books collected since 2015
Recognition
This project has received recognition at the following avenues:


Announcement of Winner at IIB Awards 2022, link to the submission
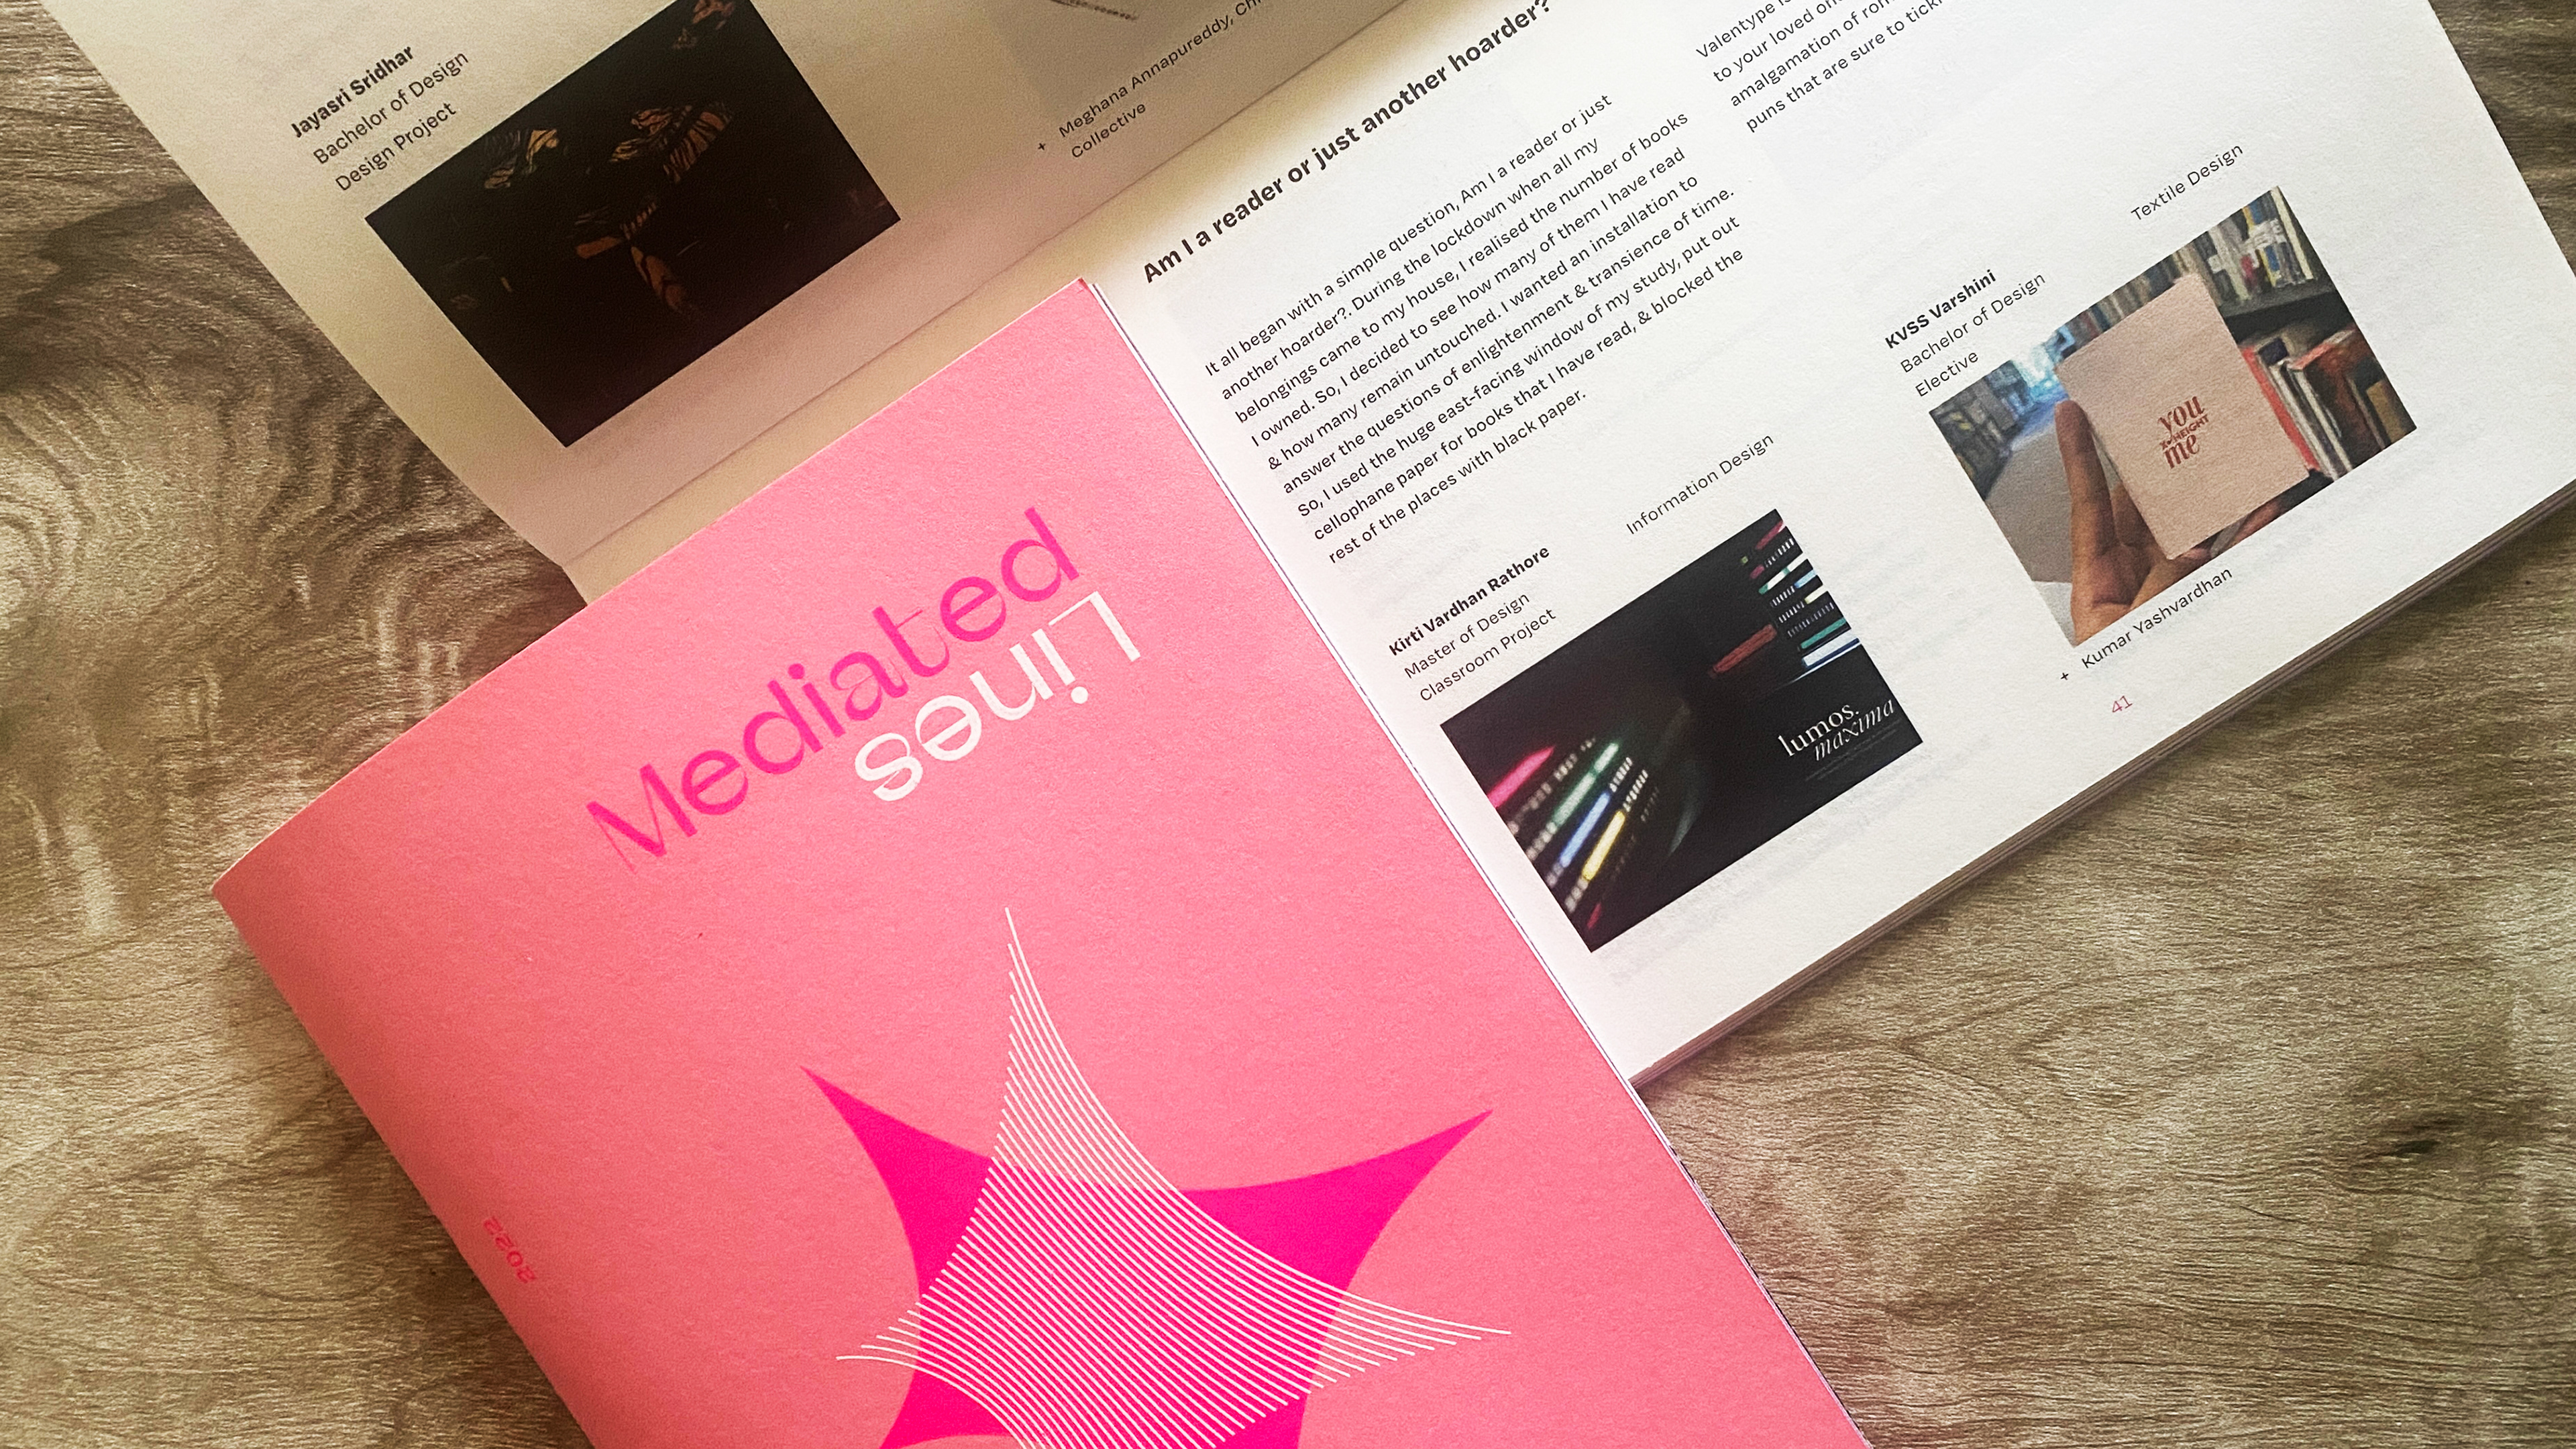
Publication of Annual Design Show 2022
I have been buying books since 2015 but since I was moving to new places because of work and transfers, I never thought that I have had too many books.
Only because of lockdown when everything came back home, I did realize their true numbers which basically justified my Mom's anger every time I ordered a new book.
She kept on saying that I should read books that I already have instead of buying more and I used to casually reply, 'Ma, I have read a lot of them'. (I couldn't have been more wrong)
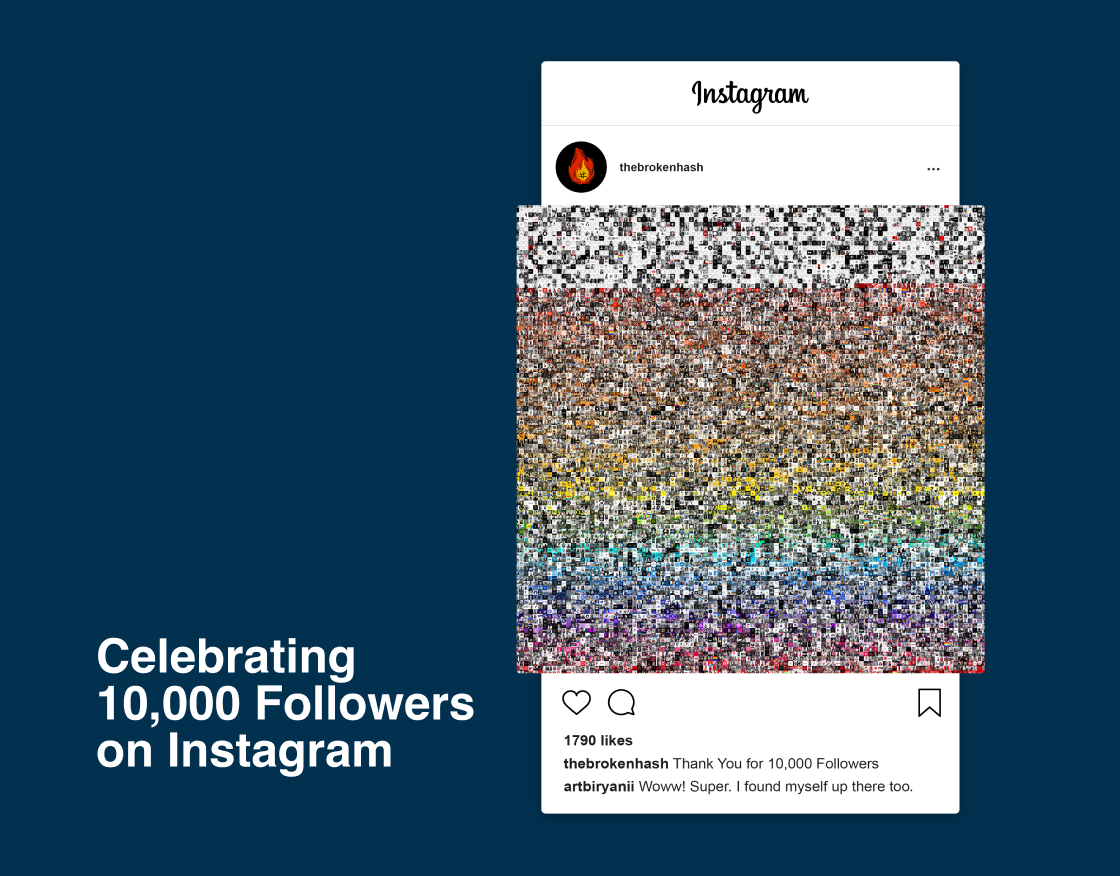
Then when @rasagy asked us to do a tangible visualization of a personal set of data, I already knew what to pick and what question to answer.
"Am I a reader or just another hoarder?"
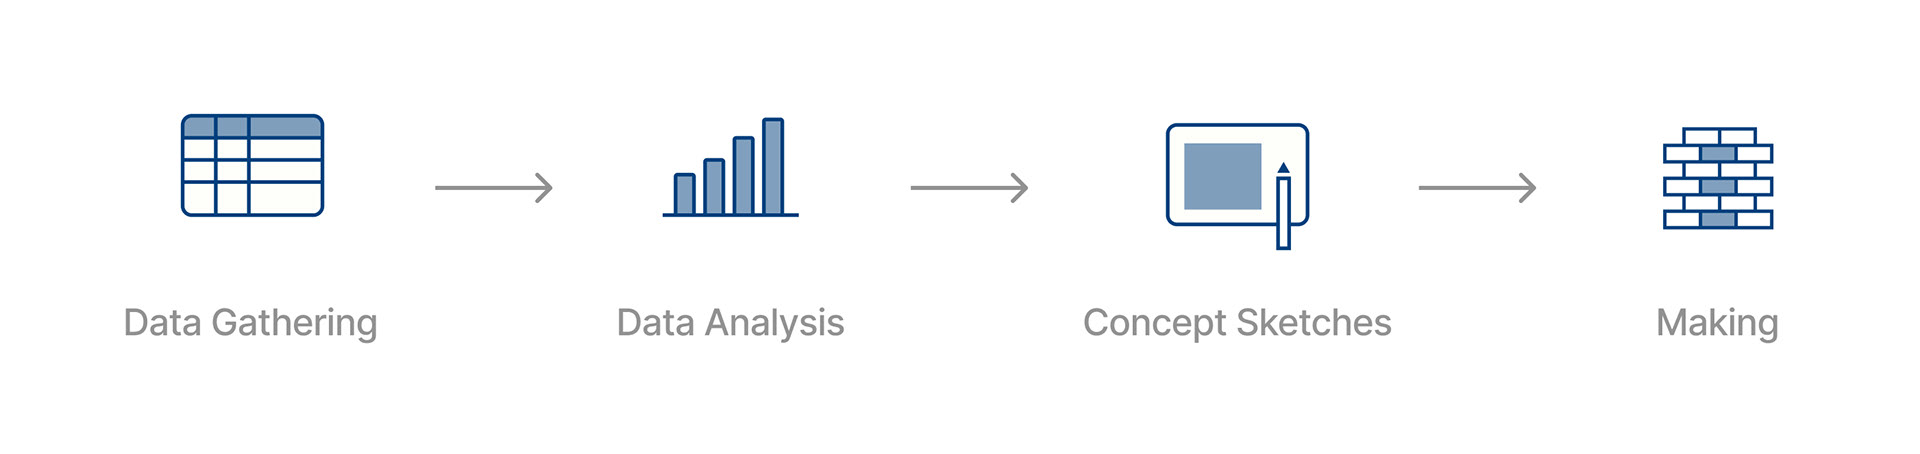
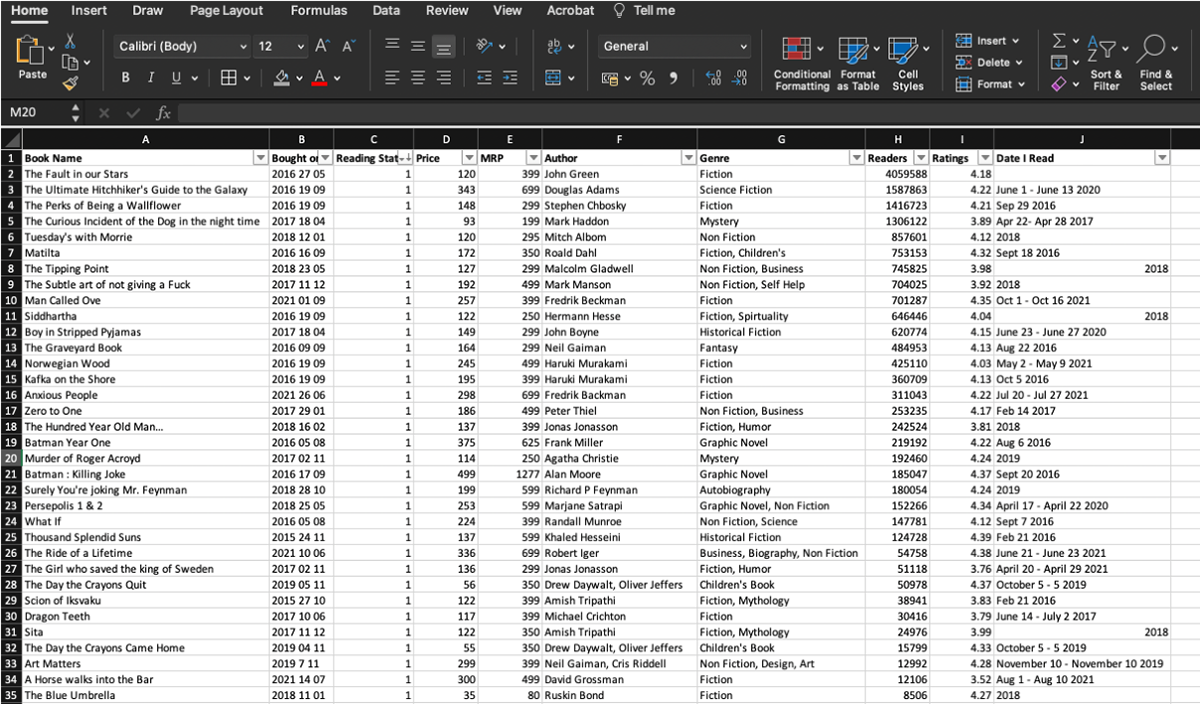
Data collected in Microsoft Excel
Data from all Amazon and Flipkart accounts were collected in excel and played around using pivot table only to confirm that I am a hoarder…
Deep down I knew it and now I needed new questions to answer now.
Once the first question was answered I decided to consider "Why I read?". The primary reason came out to be enlightenment.
Another takeaway I wanted out of the visualization was to make me less of a hoarder and motivate me to read what I have instead of ordering more.
So the new questions that came out were:
How do I show enlightenment or lack of it with the data that I have?
How can the visualization make me read more?
As per "The Physical Visualization of Information: Designing Data Sculptures in an Educational Context" by Andrew Vande Moere and Stephanie Patel physical data visualizations can have three types of representational fidelity:
1. Symbolic: We define symbolic representations to be works characterized by a form-finding approach that employs a so-called arbitrary data-mapping approach, that is it has no meaningful conceptual connection to the data.
2. Iconic: Iconic representations bear resemblance to the signified by means of a well-chosen metaphor. Metaphors are culturally defined, arbitrary, conventional representations that derive expressive power from the extent to which its context is understood.
3. Indexical: Representations that bear a direct relationship (either physically or causally) with the signified are defined as being indexical.
Indexical Installation!
We started working on an Indexical representation of the data and this is how it looked:
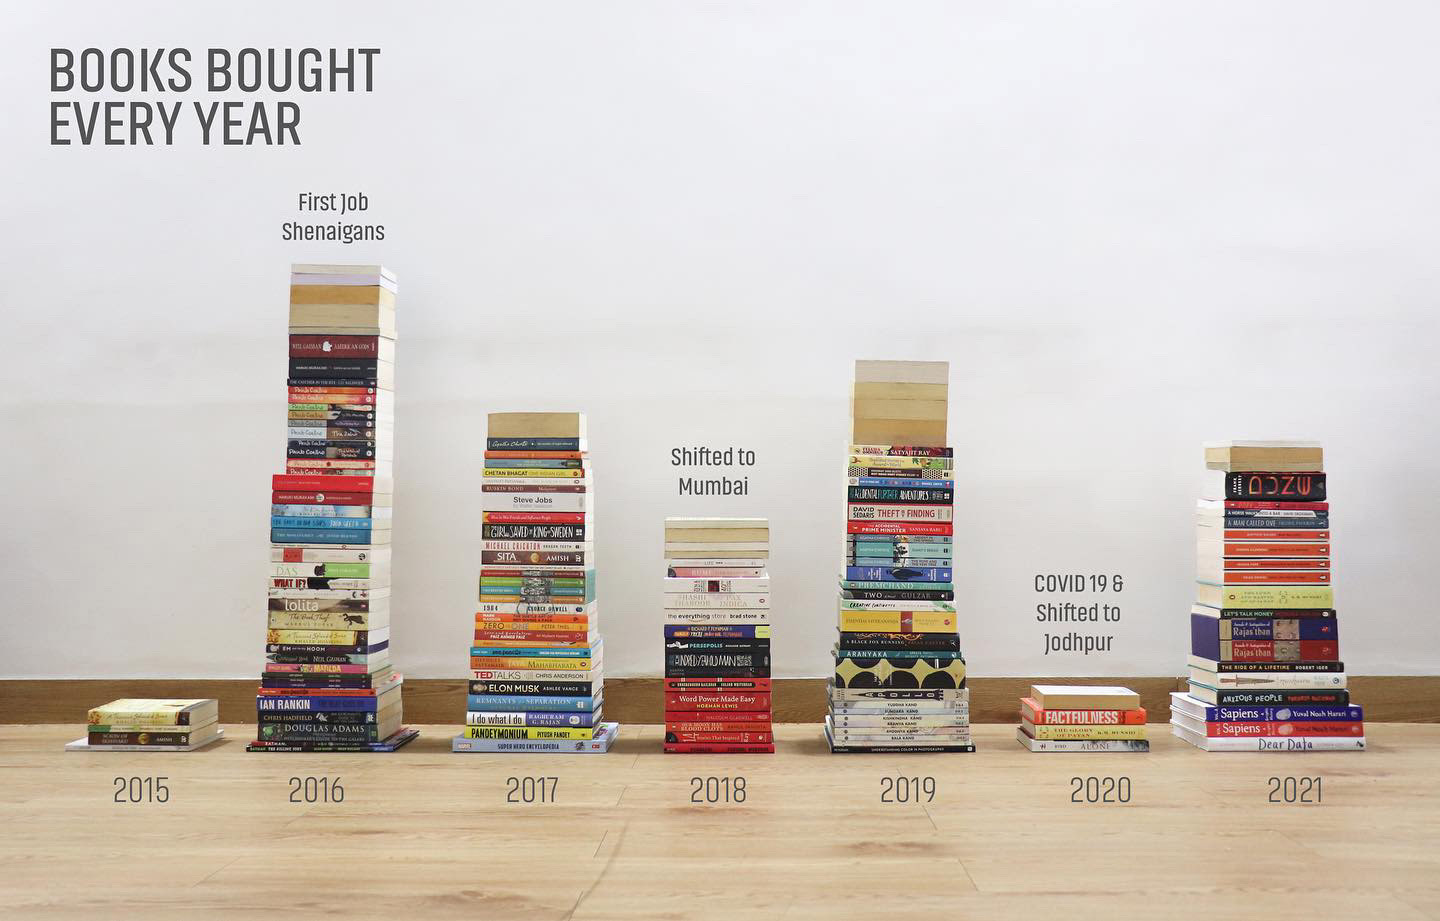
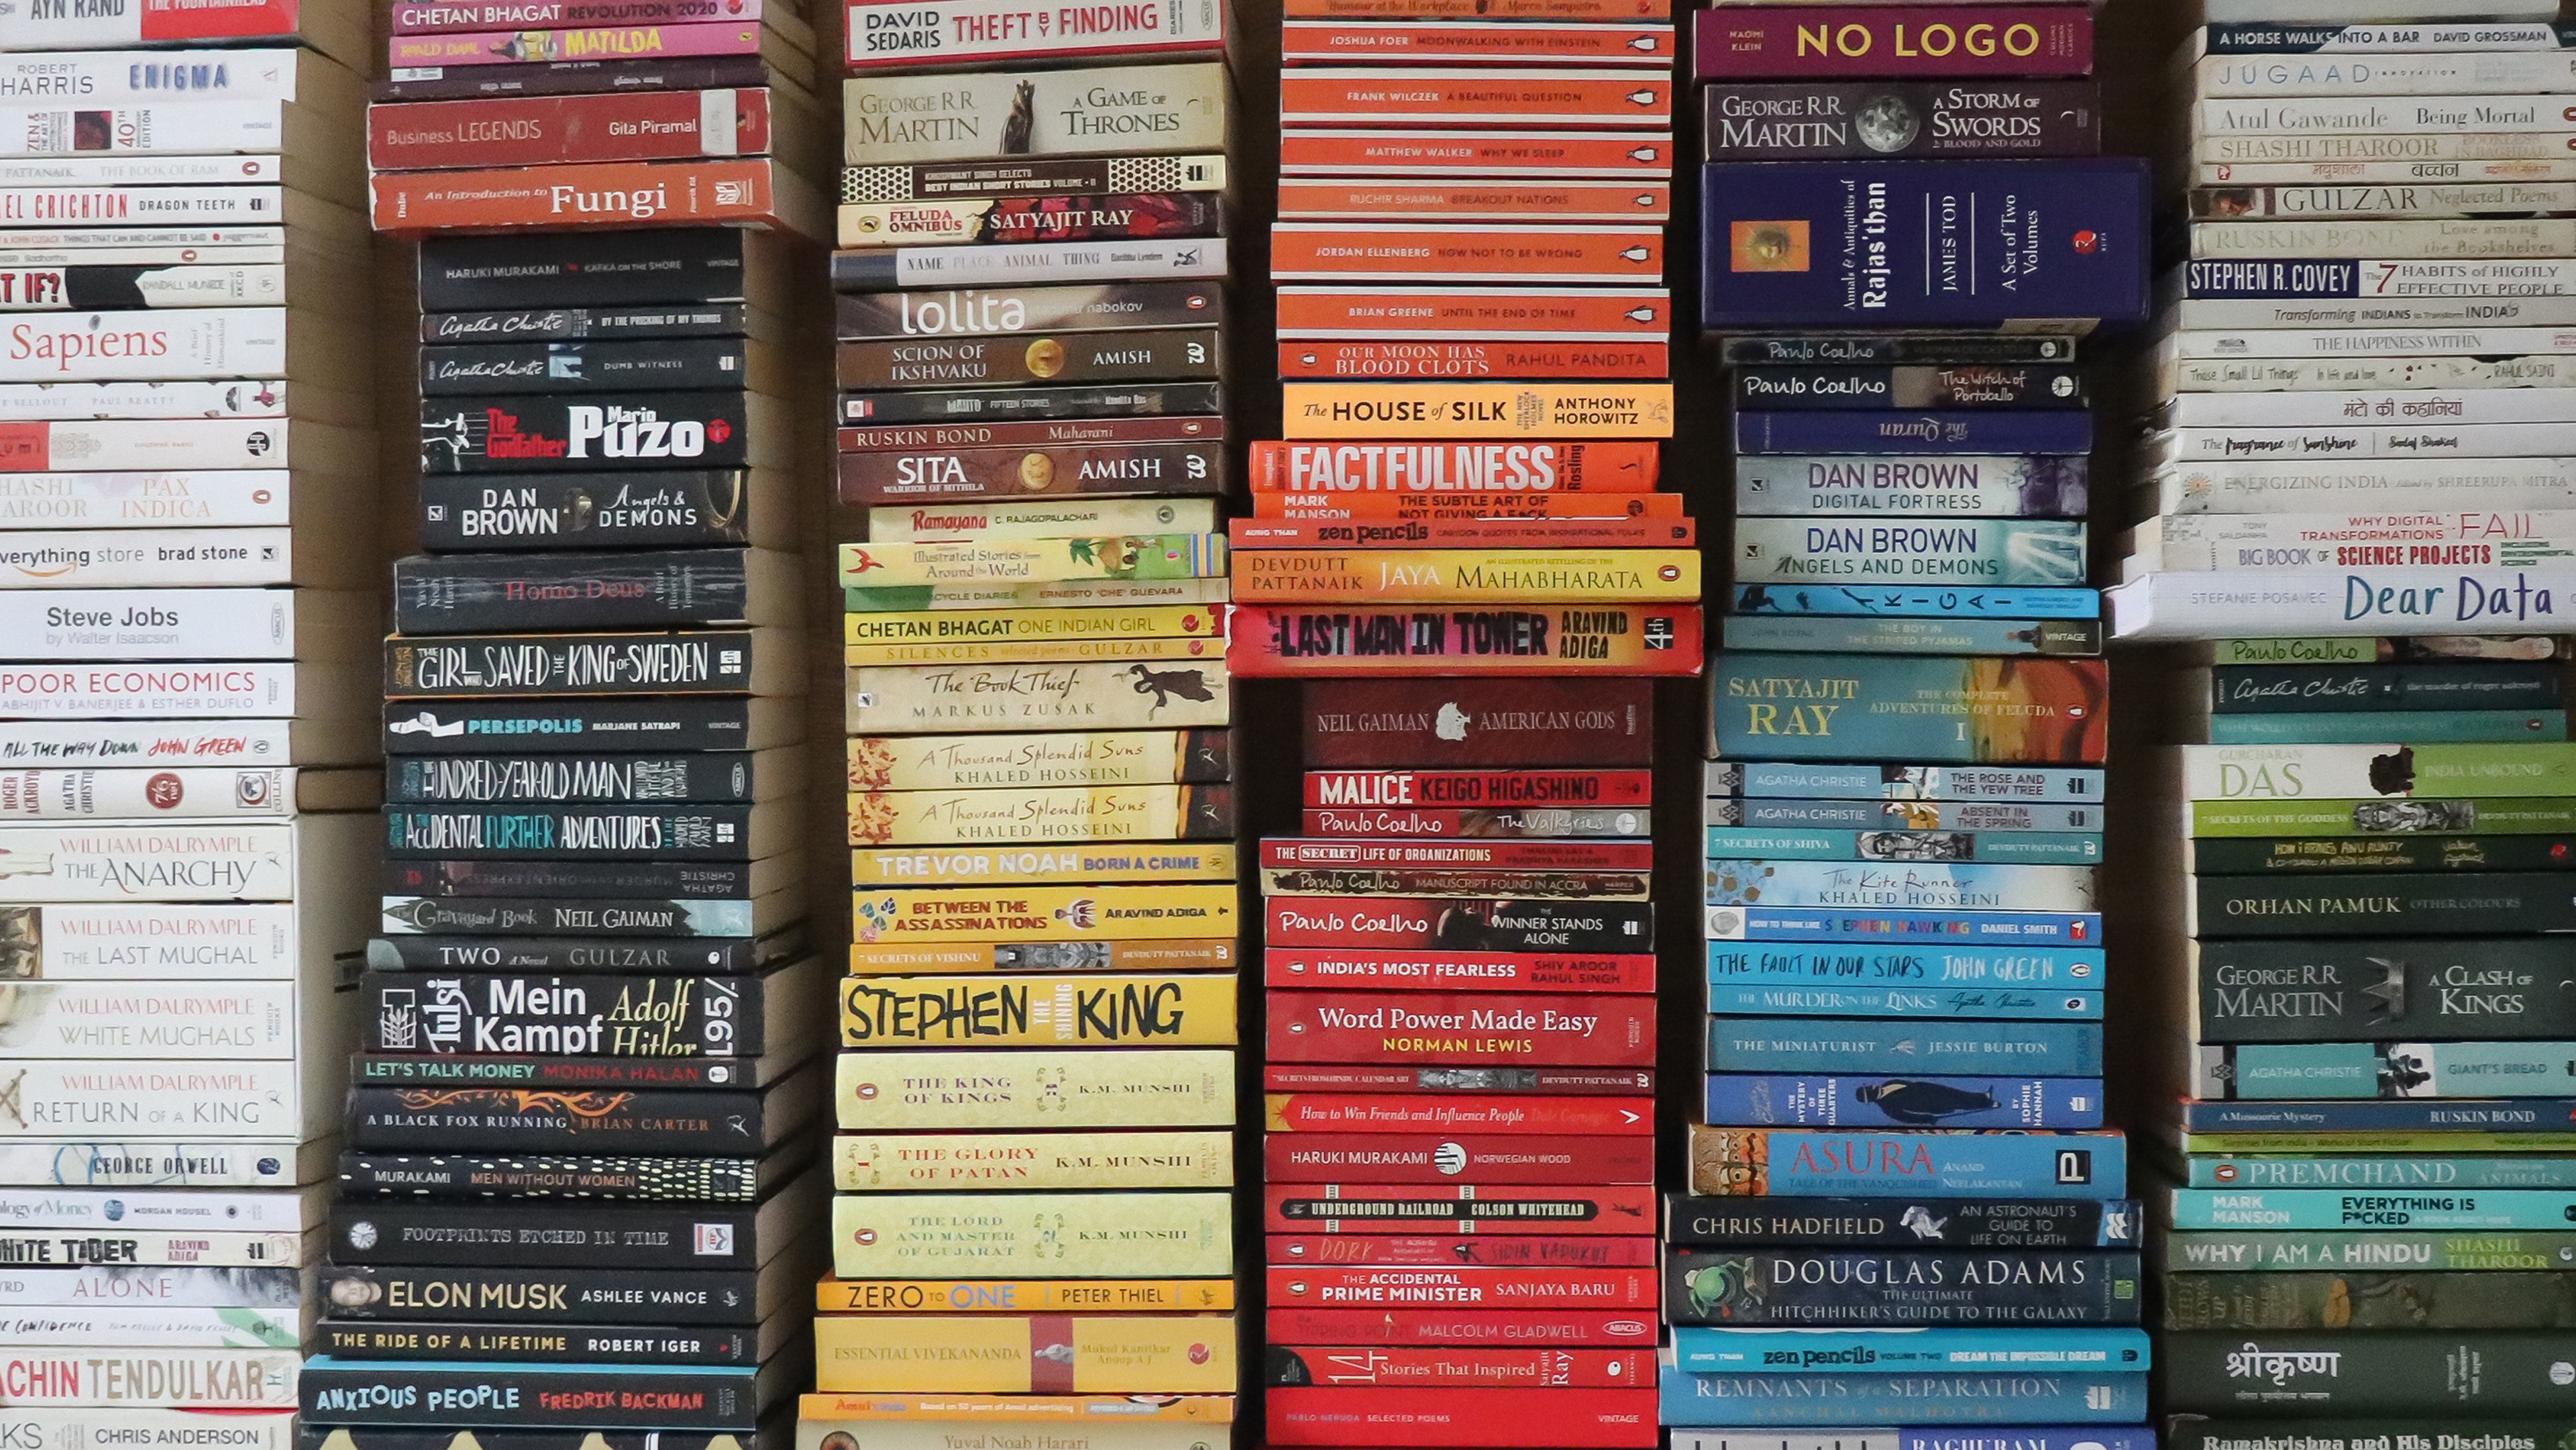
Part 1: PhotoViz of all the books I have bought online
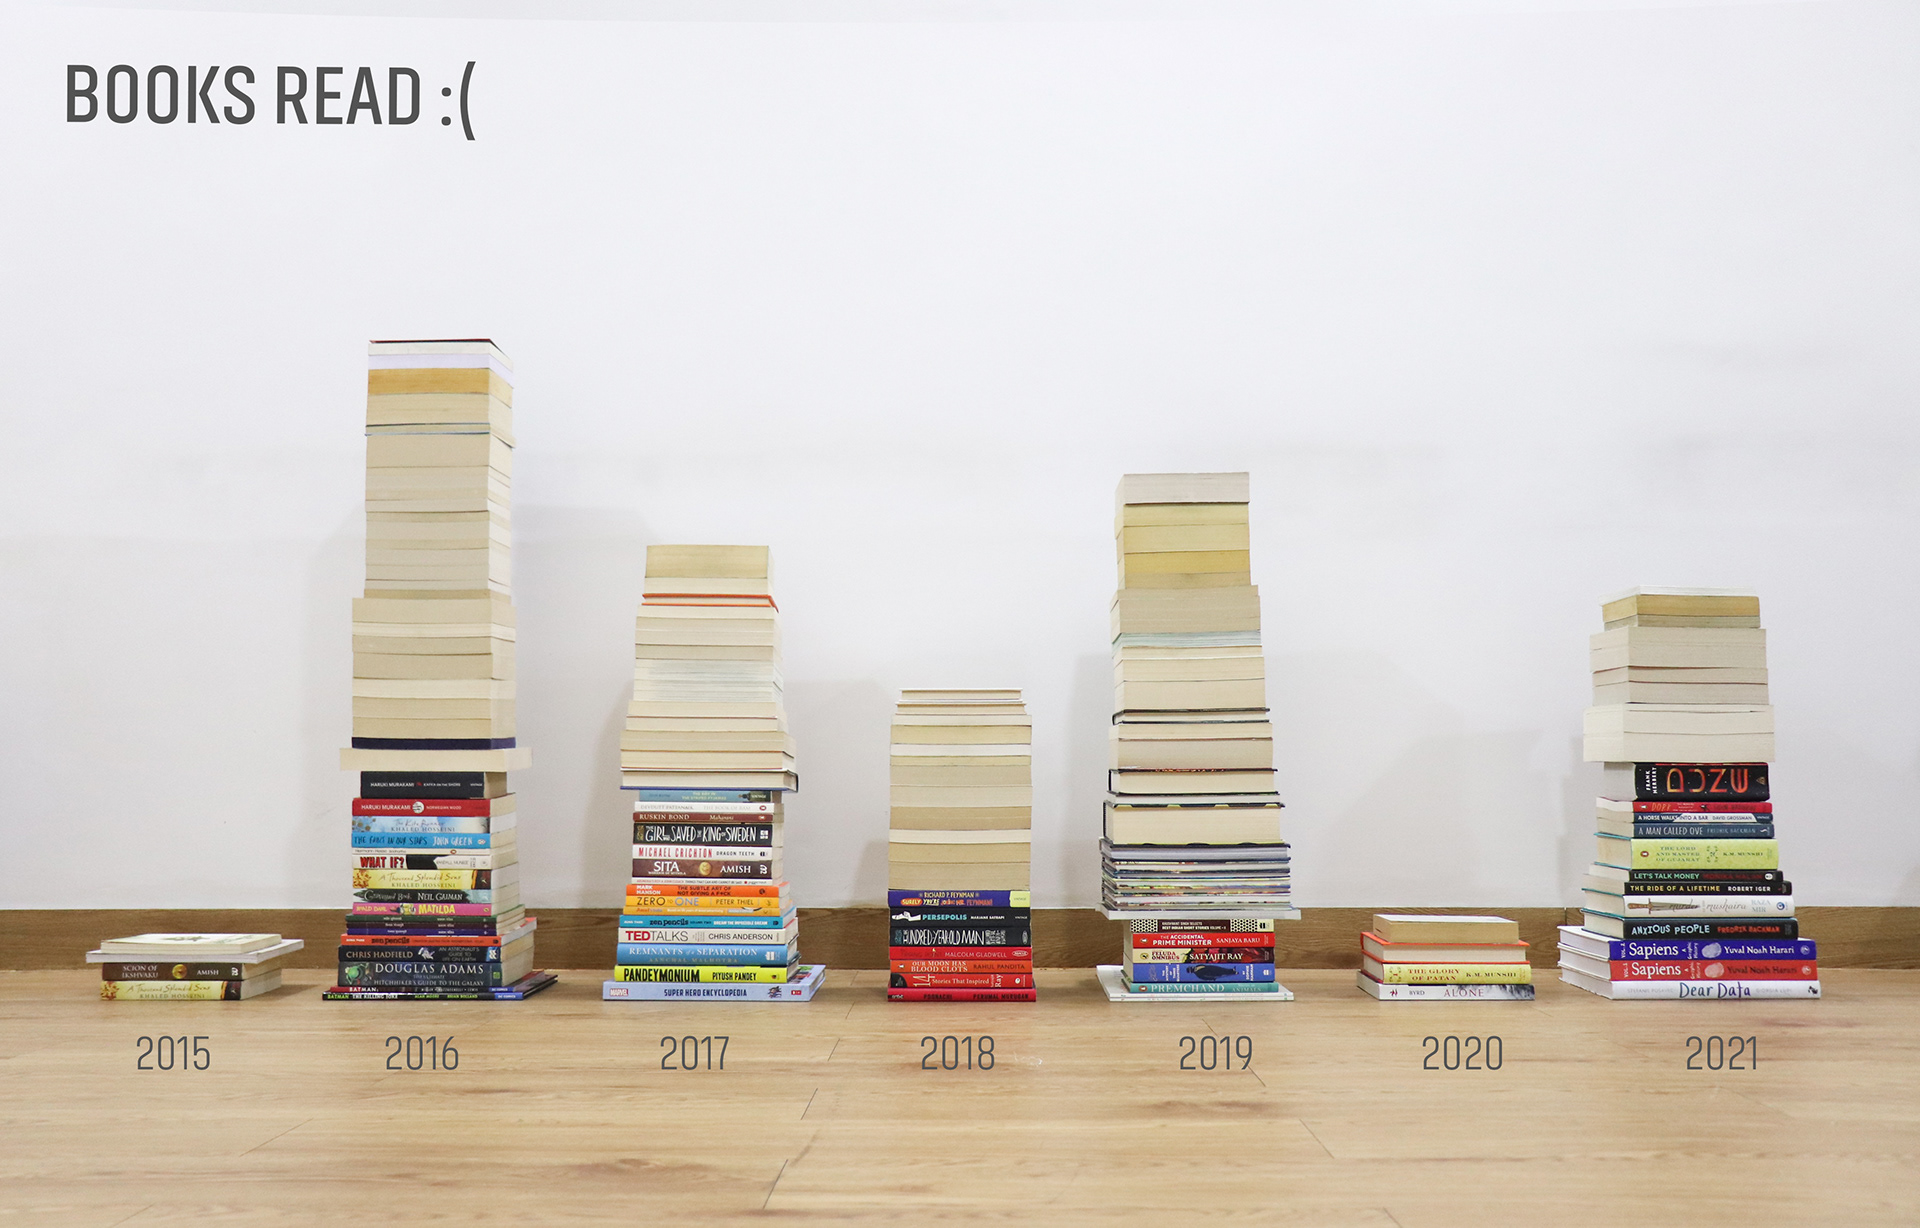
Part 2: Only the spines of the books I have read are visible
---------------------------------------------
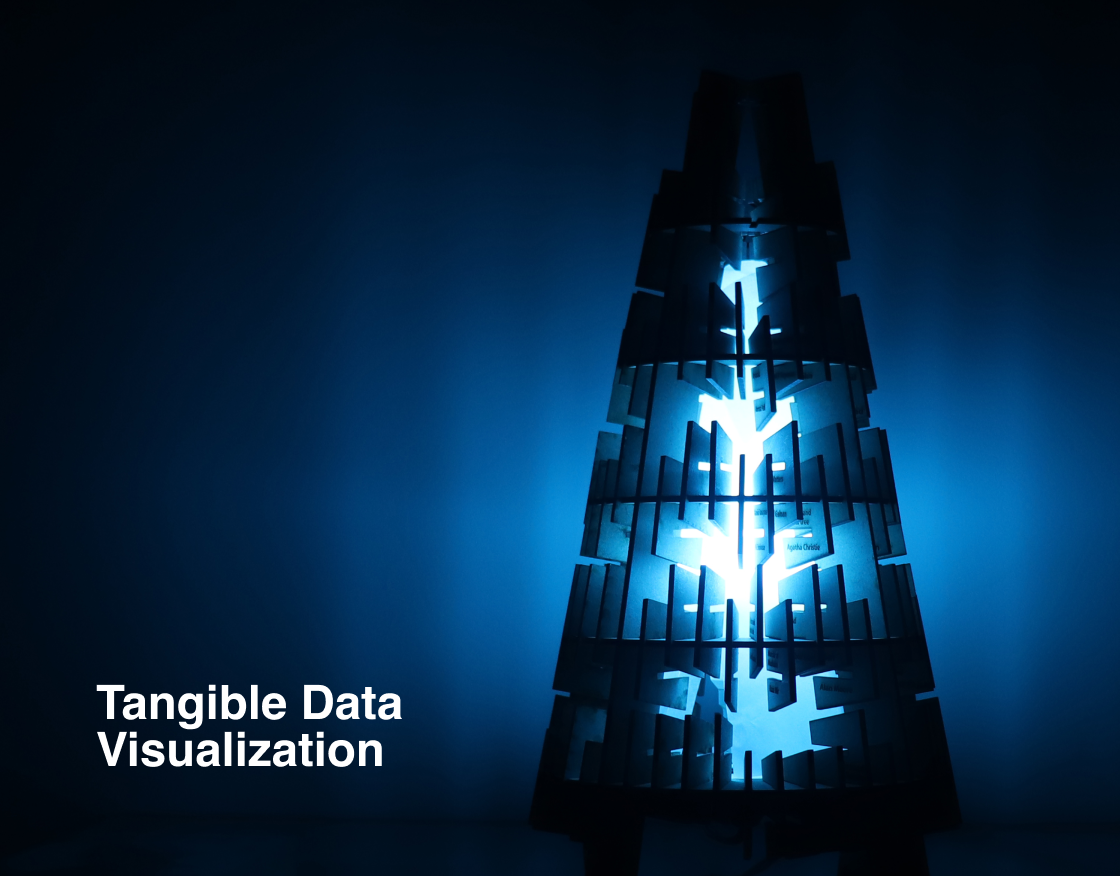
Main Event! - Lumos Maxima
During this module of Tangible Data viz, I was home and was a bit sad about the fact that I won't be able to use the 3D printing and laser cutting tools that the National Institute of Design offers but this proved to be a blessing in disguise.
My study has a vast east-facing glass window with blinds and every morning I see the light and shadows playing on the walls of my room. I decided to use this window as a part of my visualization.
Metaphor in Place
The light will be used to show enlightenment and the moving shadows will show passing of time and its finite nature.
Prototype
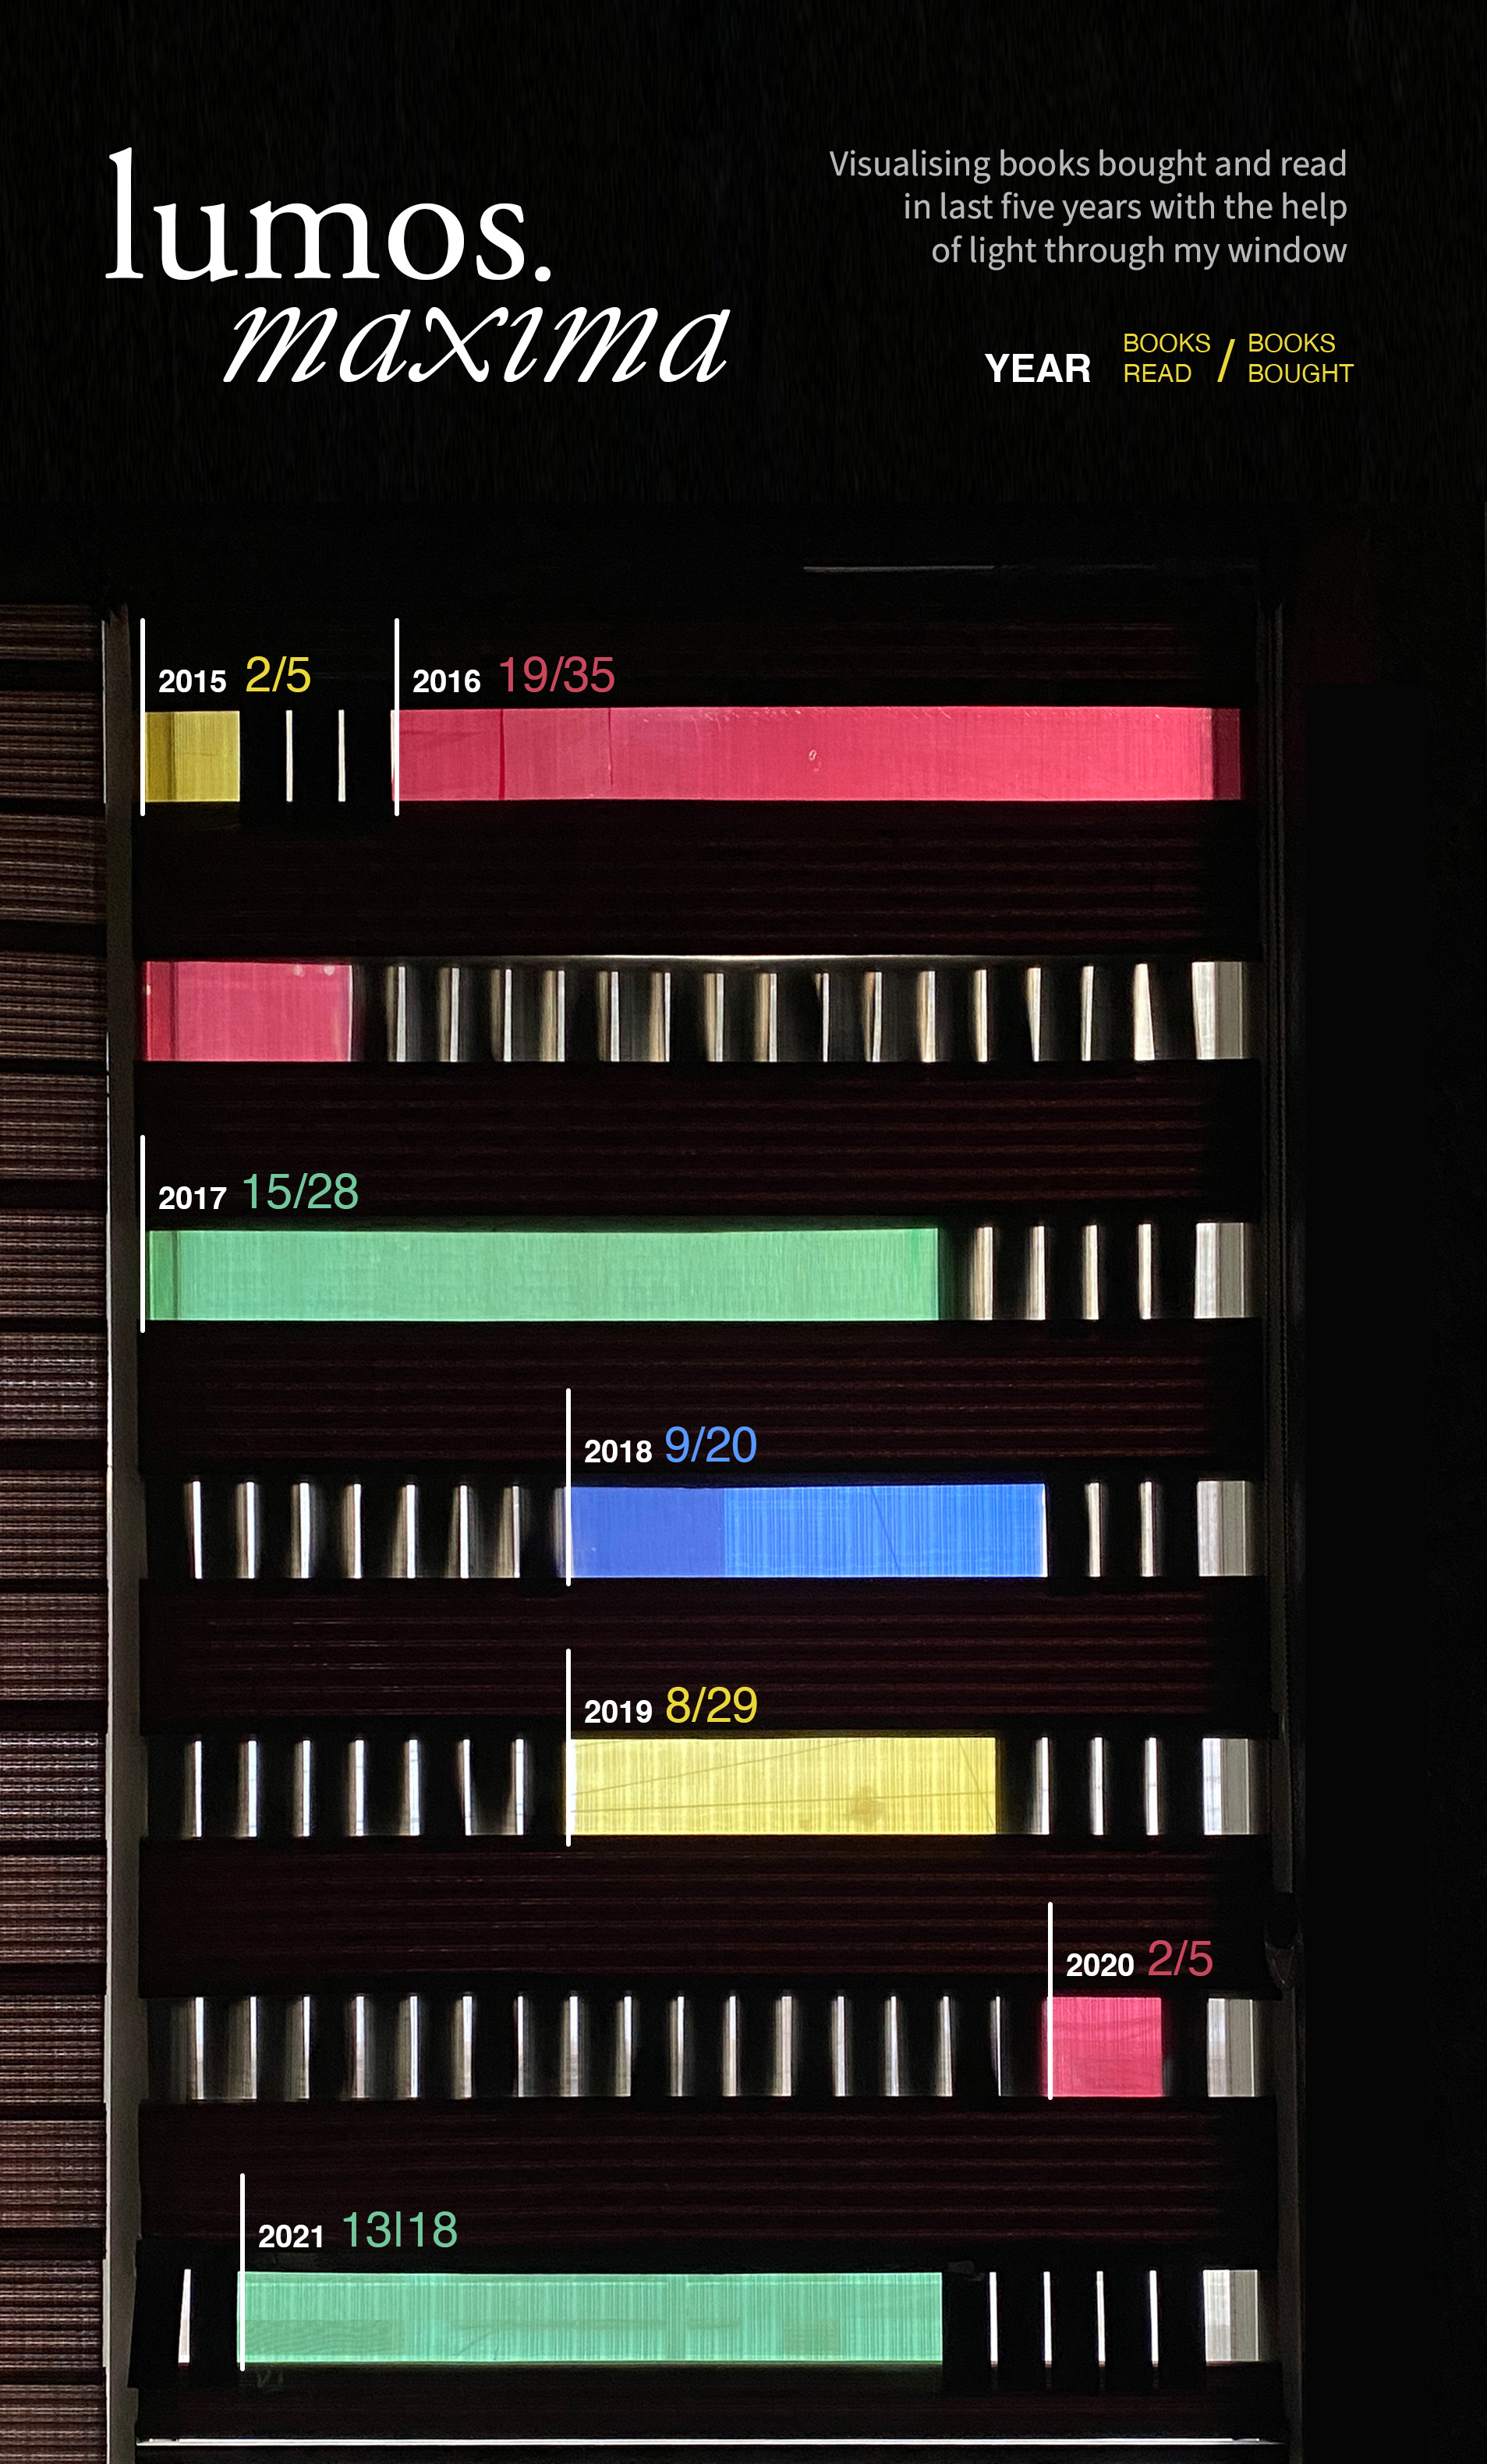
A stacked and continuous bar chart was made using cellophane paper and a black sheet. Cellophane paper was used for books that were read, allowing the light to pass through them, and black sheets for books that weren't read.

Study and the large window
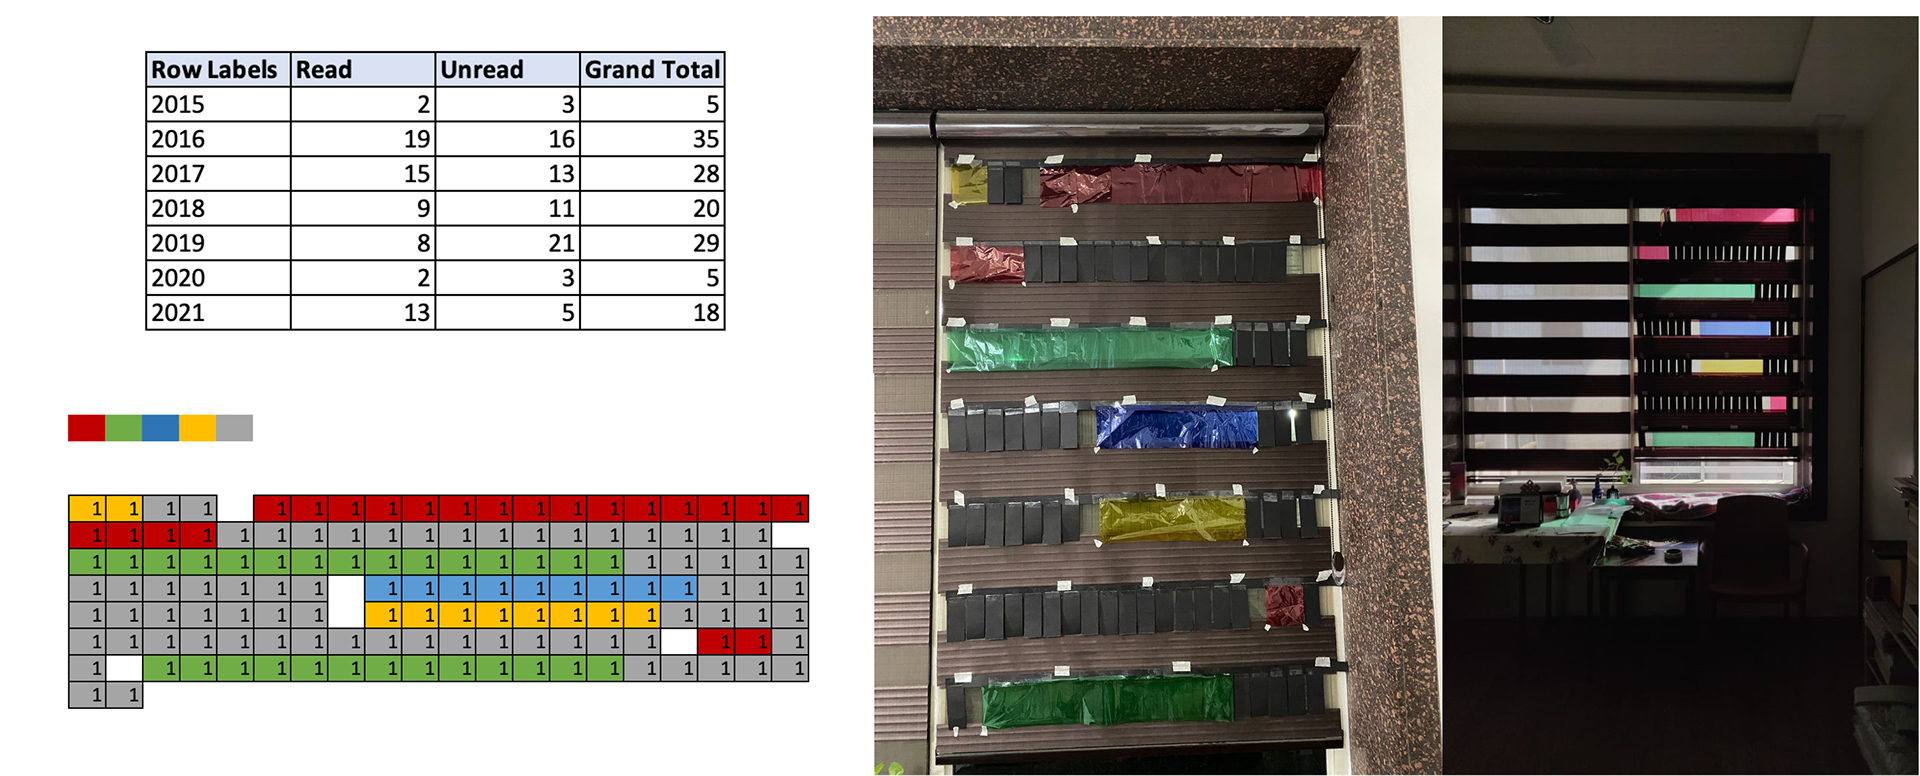
Prototype: Data Sheet, prototyping the chart on the window and waiting for sunrise
It worked!
"Tomorrow the sun will rise again, we will try again."

Making of the final installation
Final Installation
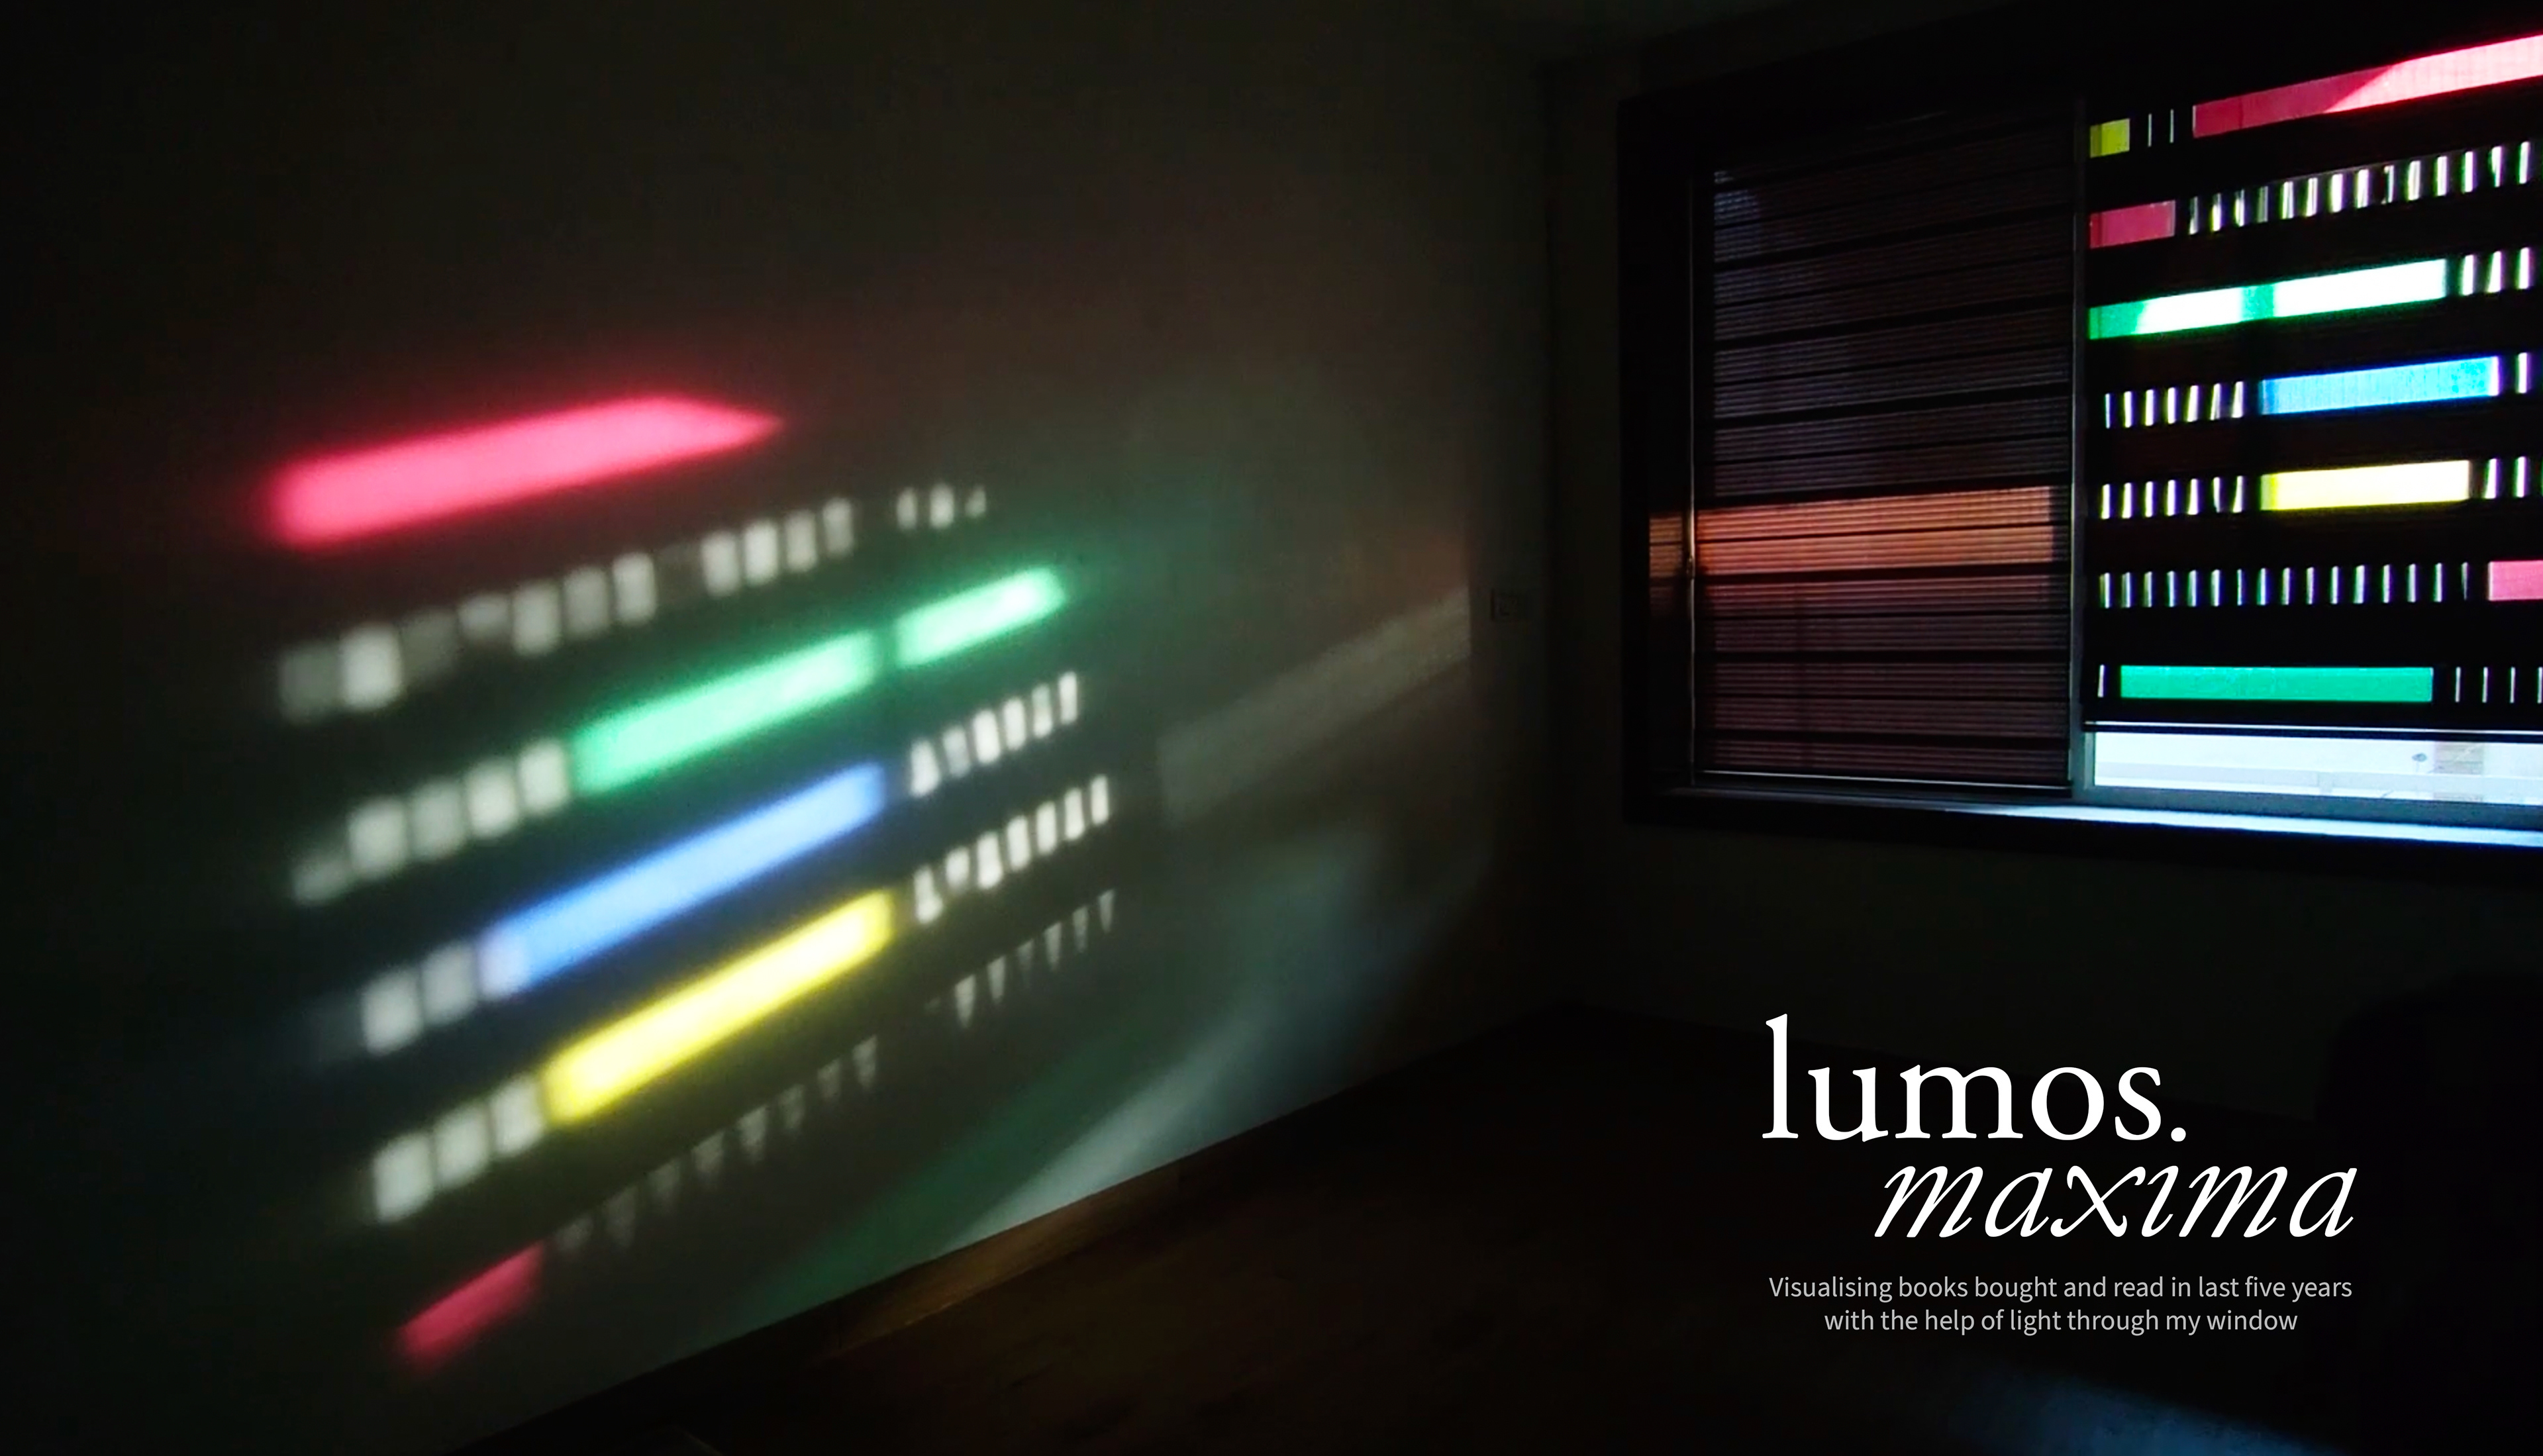
Frozen in time snippet of the installation
Final Experience. Background Track 'For your Time' by Prateek Kuhad