“India a country where 140 out of 625 candidates contesting assembly
elections are only educated till class 8th.”
elections are only educated till class 8th.”
These statistics are from phase 1 of the 2022 UP Elections. We don’t even know what the state of other states is. If these candidates win, it will be a dire state of India that still goes under the tag of a ‘developing nation’.
However, India has seen well-educated and erudite political leaders who created a unique and resilient set of democratic institutions that have strengthened over time. And yet, more recent endorsements have yielded a large number of poorly educated candidates; that includes an uneducated Chief Minister, an uneducated dacoit MP and even MPs and MLAs who couldn’t even read their respective oaths.
All this was supposed to change after the advent of a political party started by an IITian. There have been a lot of debates on how educated political candidates can bring a change in Indian politics. It has been almost 10 years since this IITian came into the picture as a politician. They have been ruling in the National Capital of India and in some of the state elections, they are faring slightly better than one of the ‘dynastic’ parties of our country.
In India, you need to be at least a 10th pass to even apply for a peon's job in the government. Curiously enough, there's no such educational stipulation to become a Mantri. So, we want to put a data-backed narrative on how our wannabe Mantri are exploiting this lack of qualification to rise up the rungs of Indian Politics.
What does India think?
We conducted a survey about the perception of citizens toward the educational qualifications of Members of Parliament in Power. We received a total of 105 responses and these are the findings:
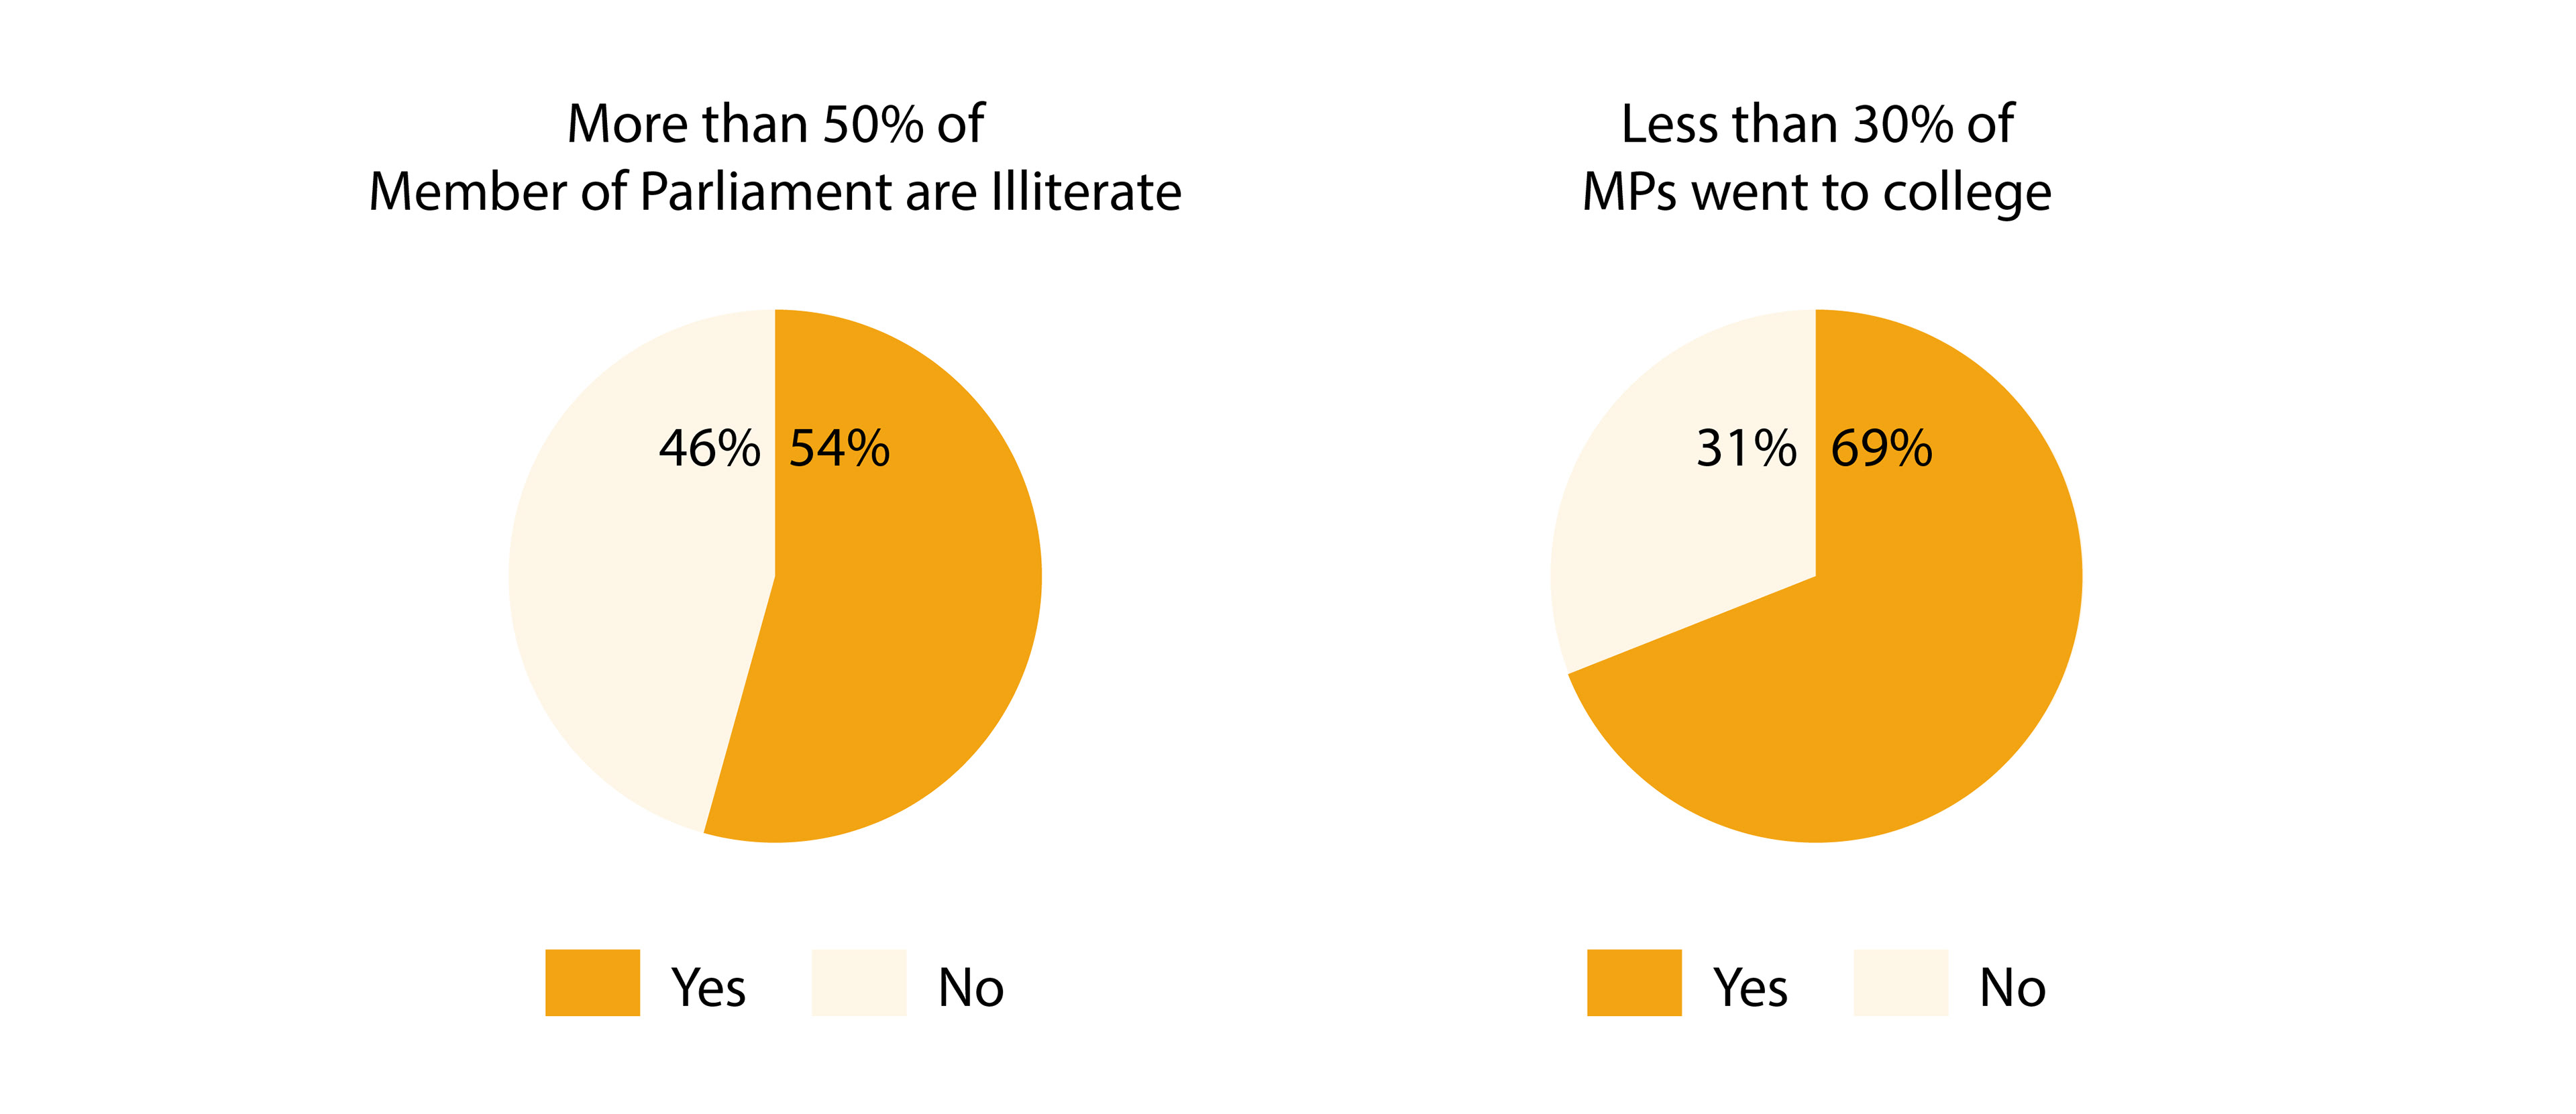
Summarizing findings,
54% of the respondents believed that more than 50% of our MPs are illiterate and
only 31% believe that more than 30% have at least a graduate degree.
To be very honest, we too believed the same.
only 31% believe that more than 30% have at least a graduate degree.
To be very honest, we too believed the same.
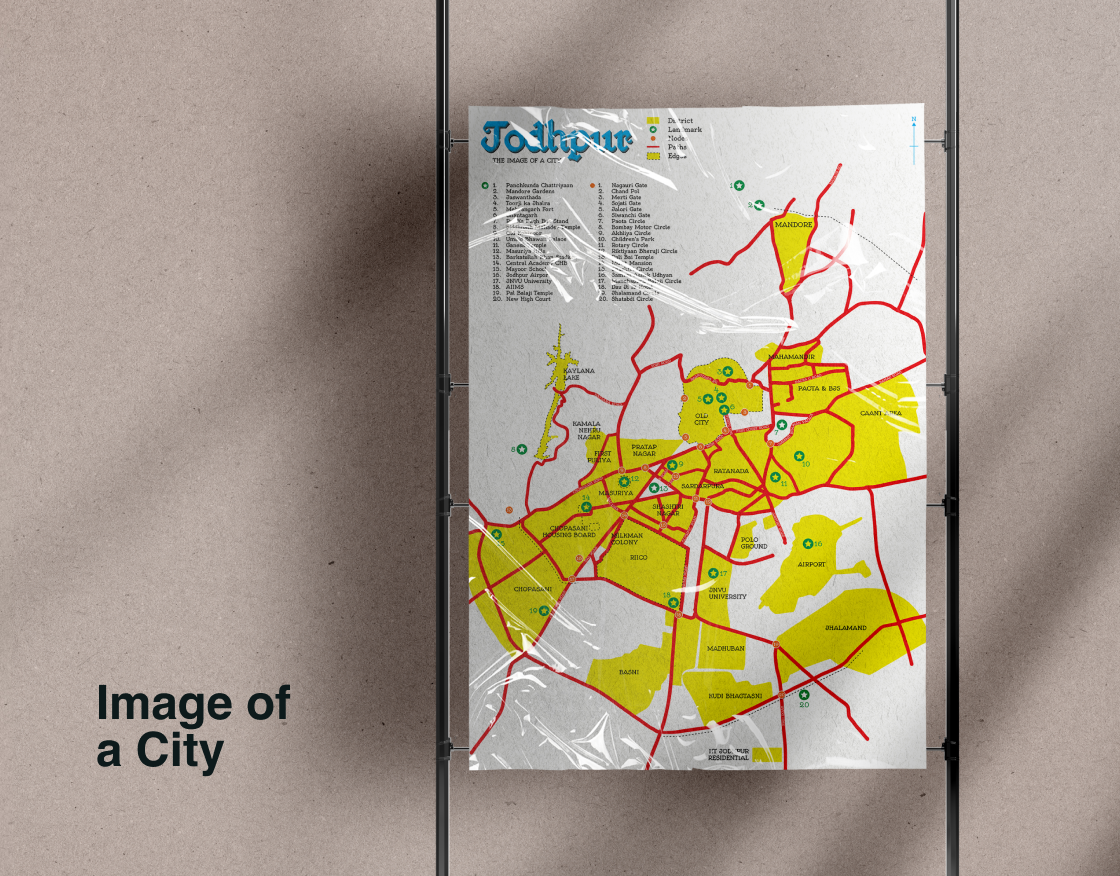
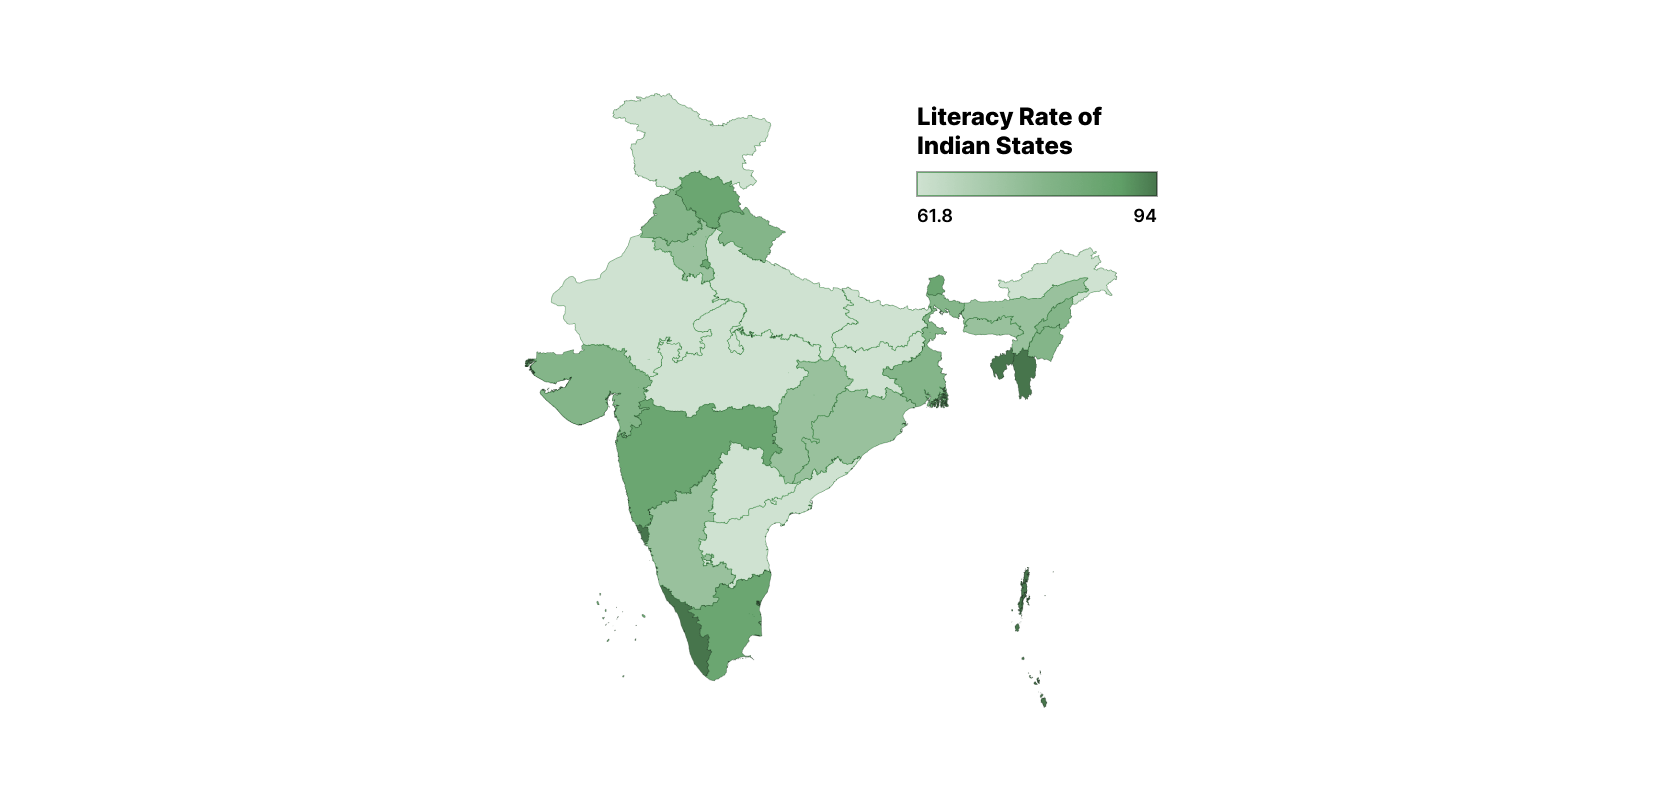
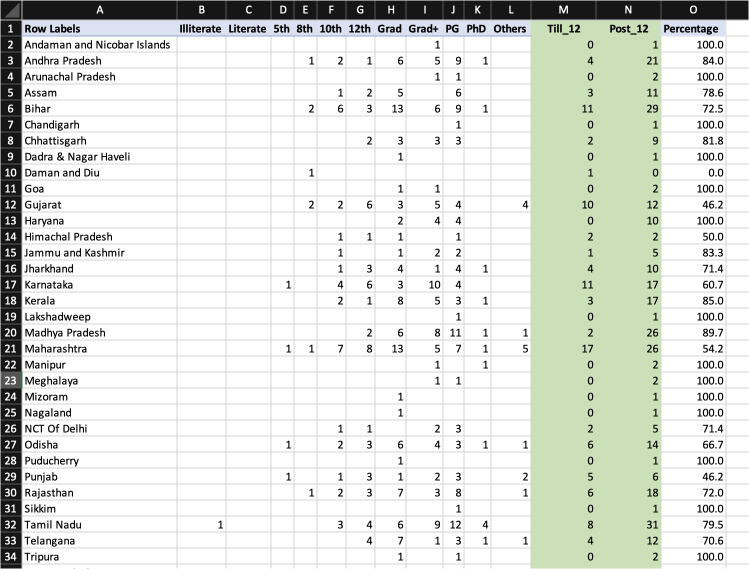
Literacy rates of Indian States
Raw Data
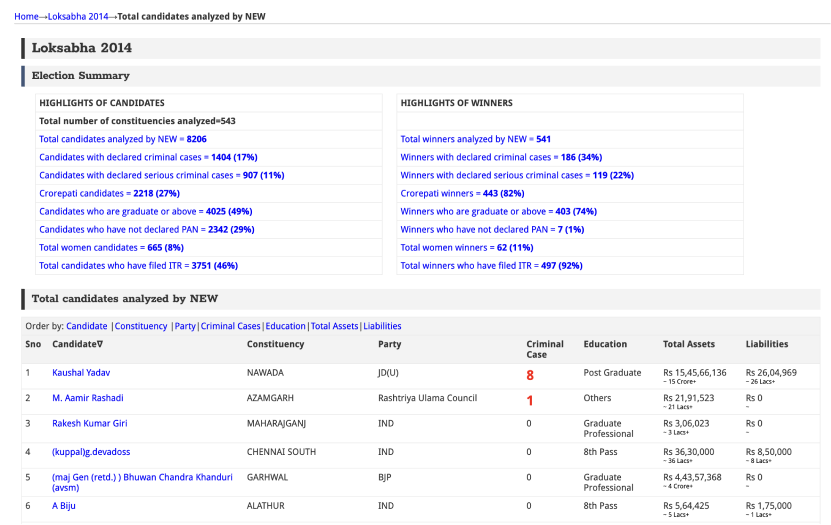
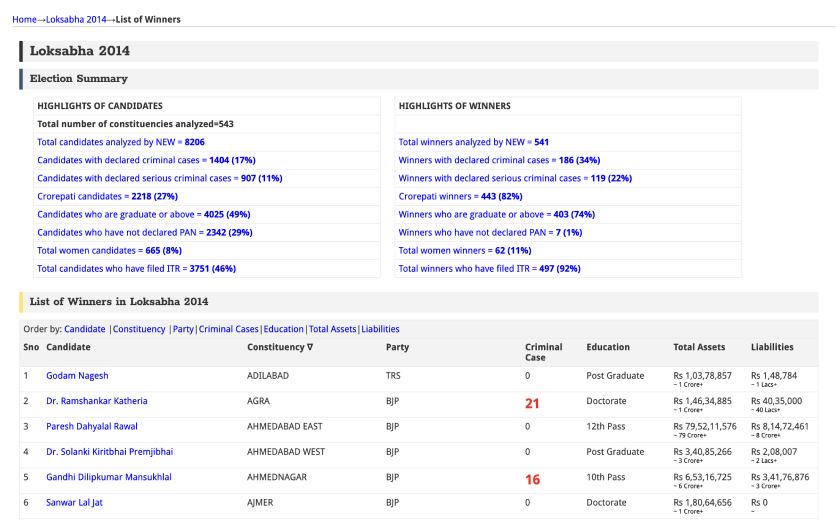
The data of the Lok Sabha elections of 2009, 2014 and 2019 was taken from the MyNeta website.
The data included Participating Candidates, Parties of Participating Candidates, Constituency, Winning Candidate and their Educational Levels.
MyNeta organizes Educational Qualification across 10 levels; Illiterate, Literate, 5th Pass, 8th Pass, 10th Pass, 12th Pass, Graduate, Graduate Professional, Post Graduate and Doctorate.
There are also some candidates with ‘Not Given’ and ‘Others’ also as Educational Qualification but since their number is extremely low, they are ignored.
The Data included 25,000+ Candidates, 680+ Political Parties and 543 Constituencies spread over 3 Lok sabha elections.
Processed Data
The Data was processed in Microsoft Excel using Pivot Table and vlookup. The Additional column of State was added, and preliminary refining was done. We also tried to determine whether in a particular constituency the Candidate with Highest Educational Qualification win or lose.
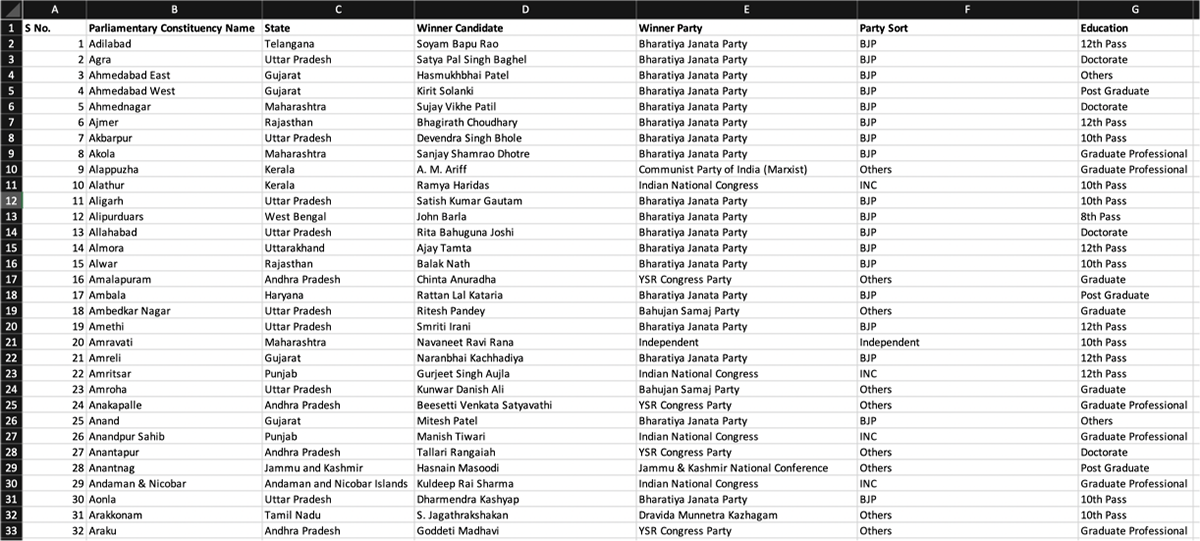
State Column Added and Clubbed Political Parties in Others
(Except INC, BJP, AAP, BSP and Independent Candidates)
(Except INC, BJP, AAP, BSP and Independent Candidates)
Pivot 1: Finding Out the Number of MPs under different Educational Qualifications this was also done for all the participating candidates as well.
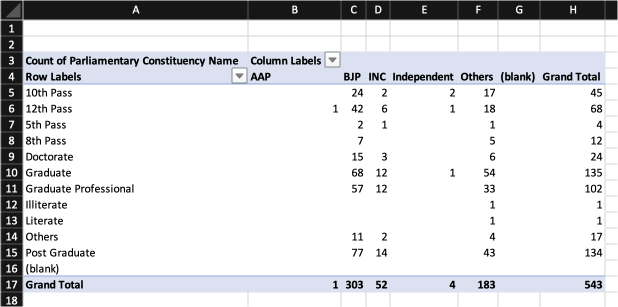
Pivot 2: Parties and number of Candidates with
different Educational Qualification
different Educational Qualification
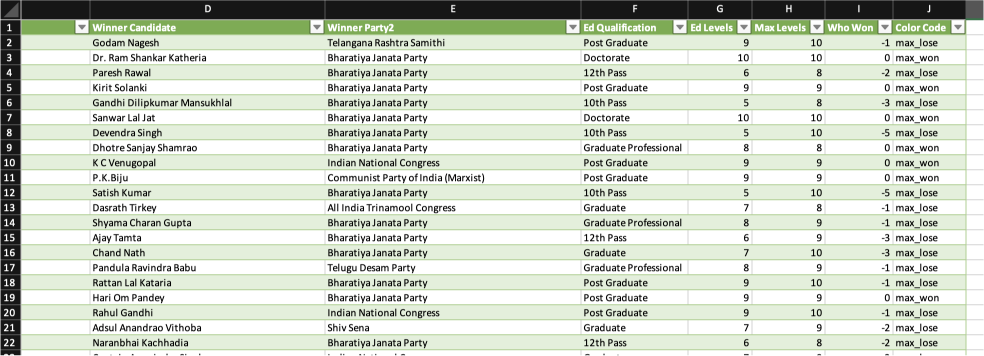
Adding an extra row to determine whether the one with the highest education
qualification won or not.
qualification won or not.
Questions
Like the survey respondents, we were also looking forward to finding a good number of illiterate MPs.
Alongside that when we started we were trying to answer the following questions:
Which of the major parties values education while giving away tickets to contest elections?
Which state/region sees what number of Educated candidates and at what levels of Education?
How did these educated candidates fare against the not-so-educated candidates if any?
How do the percentage of educated candidates and winning candidates wary?
How do the percentages vary pre and post-AAP era?
What did Data say?
With all the data in place, let's head out and see what the data has to say about the educational level of MPs and MP Candidates. We also have a closer look into party-wise and state-wise results.
We also tried to see if there is any pattern in winning of the highest qualified candidate's winning/losing. As you can see in the below maps, there isn't any.
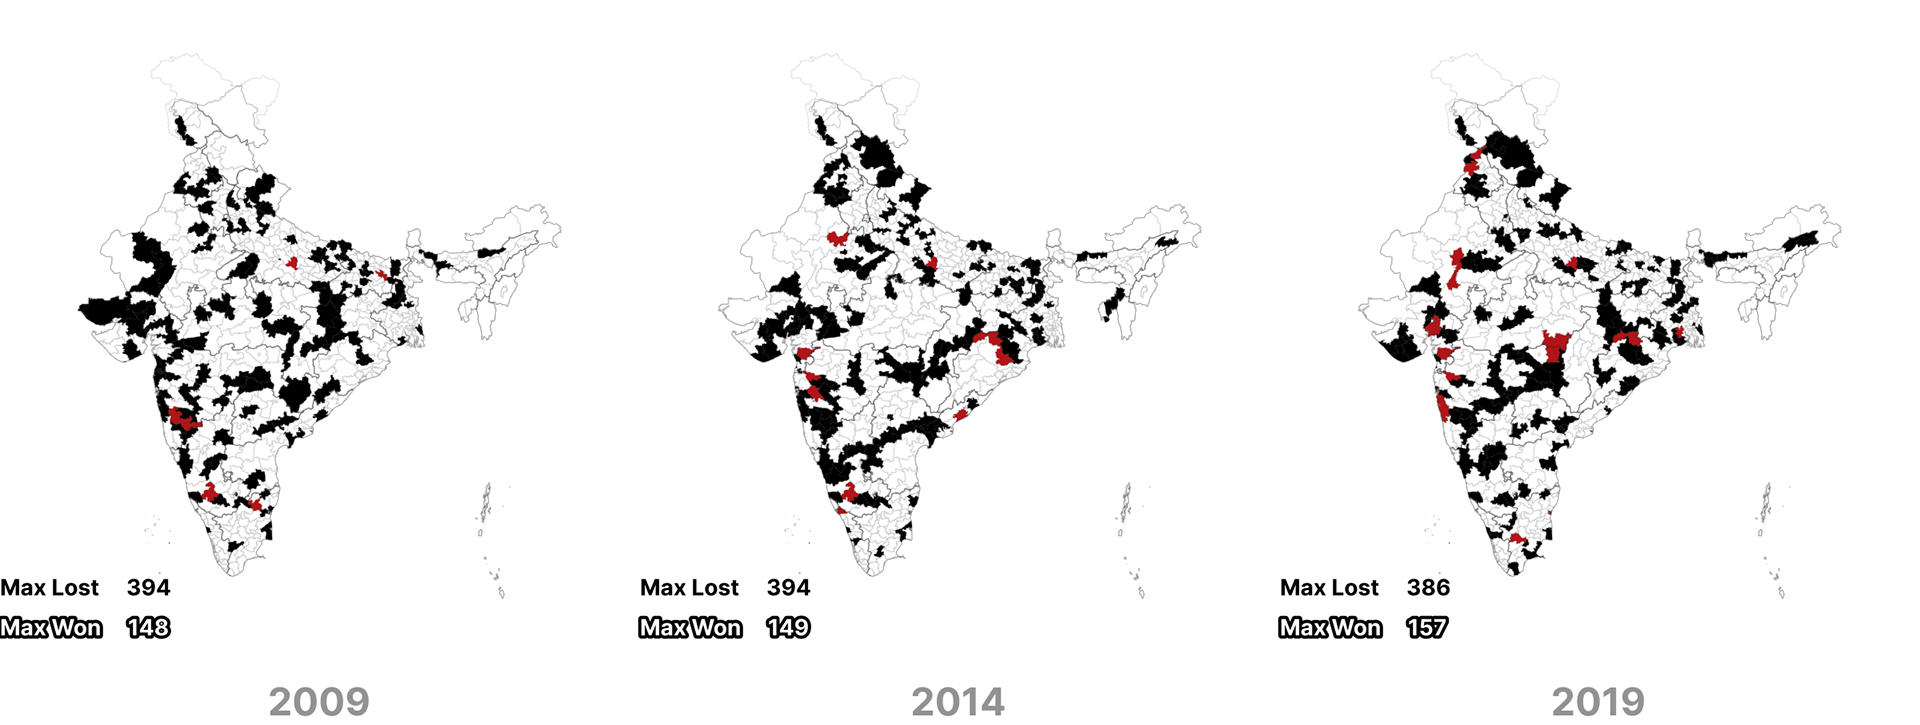
White: Constituencies where the candidate with the highest qualification won
Black: Constituencies where the candidate with the highest qualification lost
Red: Missing Data
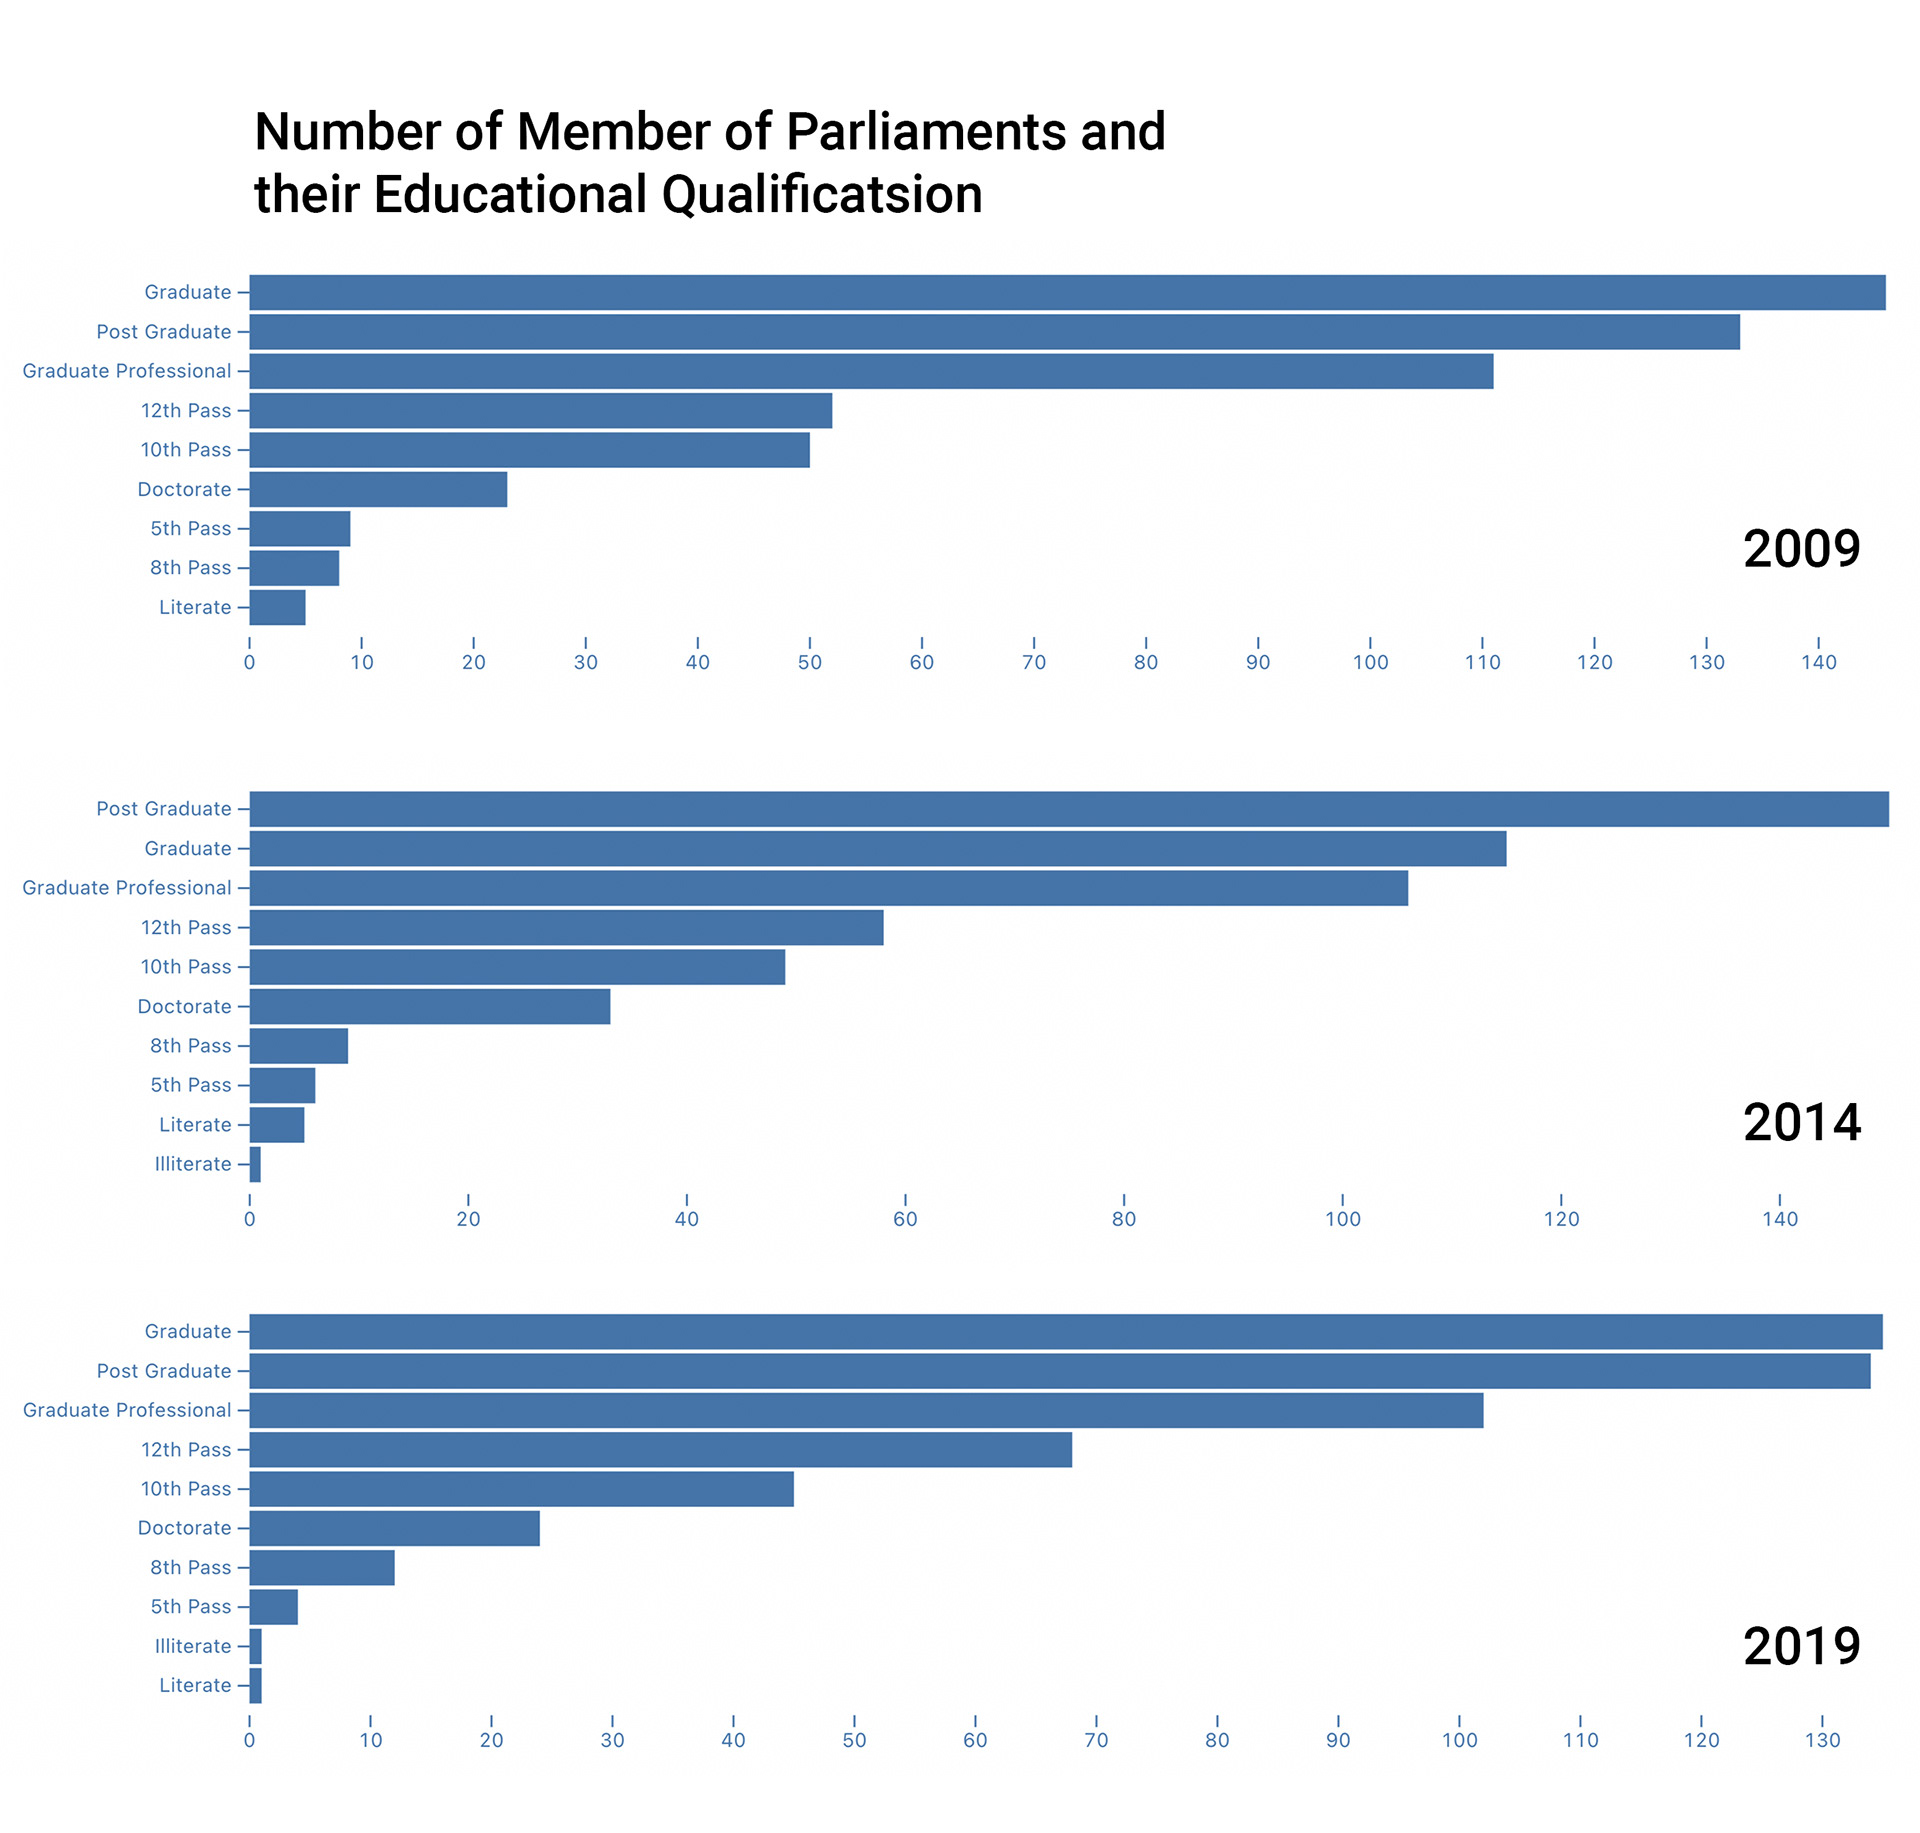
Since the 2009 elections, there are no Illiterate Members of Parliament in India.
All other detailed graphs can be seen on Sudev's Observable.
Methodology
Since there are no illiterate MPs in the Parliament, we can do away with the debate on literacy. What we further do is divide the 10 Educational Levels into just two levels.
Elementary Educated: Till 12th Pass,
Highly Educated: Graduate and Above
Since a graduation degree plays a pivotal role in a person's life and empowers him in a lot many ways, thus, graduation was chosen as the pivot.
We plotted the percentage of Highly Educated Candidates on the Map of India with a diverging color scale.
Red shows more Elementary Educated Candidates,
White Shows the midpoint; an equal number of both,
Green shows a higher number of Highly Educated Candidates.
We plotted this ratio twice for every election. One for all the participating candidates and one for the winning candidates.
We plotted this ratio twice for every election. One for all the participating candidates and one for the winning candidates.
Next, we superimposed both maps to see the changes, and to be frank we were a bit surprised.
Following are the gifs of the superimpositions.
Conclusion
It is pretty clear from the above chloropleths that most of the
States are offered an almost equal mix of Highly Educated and Elementary Educated candidates but once they pass the test of Public, the mix has a higher number of Highly Educated Ones.
Alternative Representation
The shift of bubbles is self-explanatory.
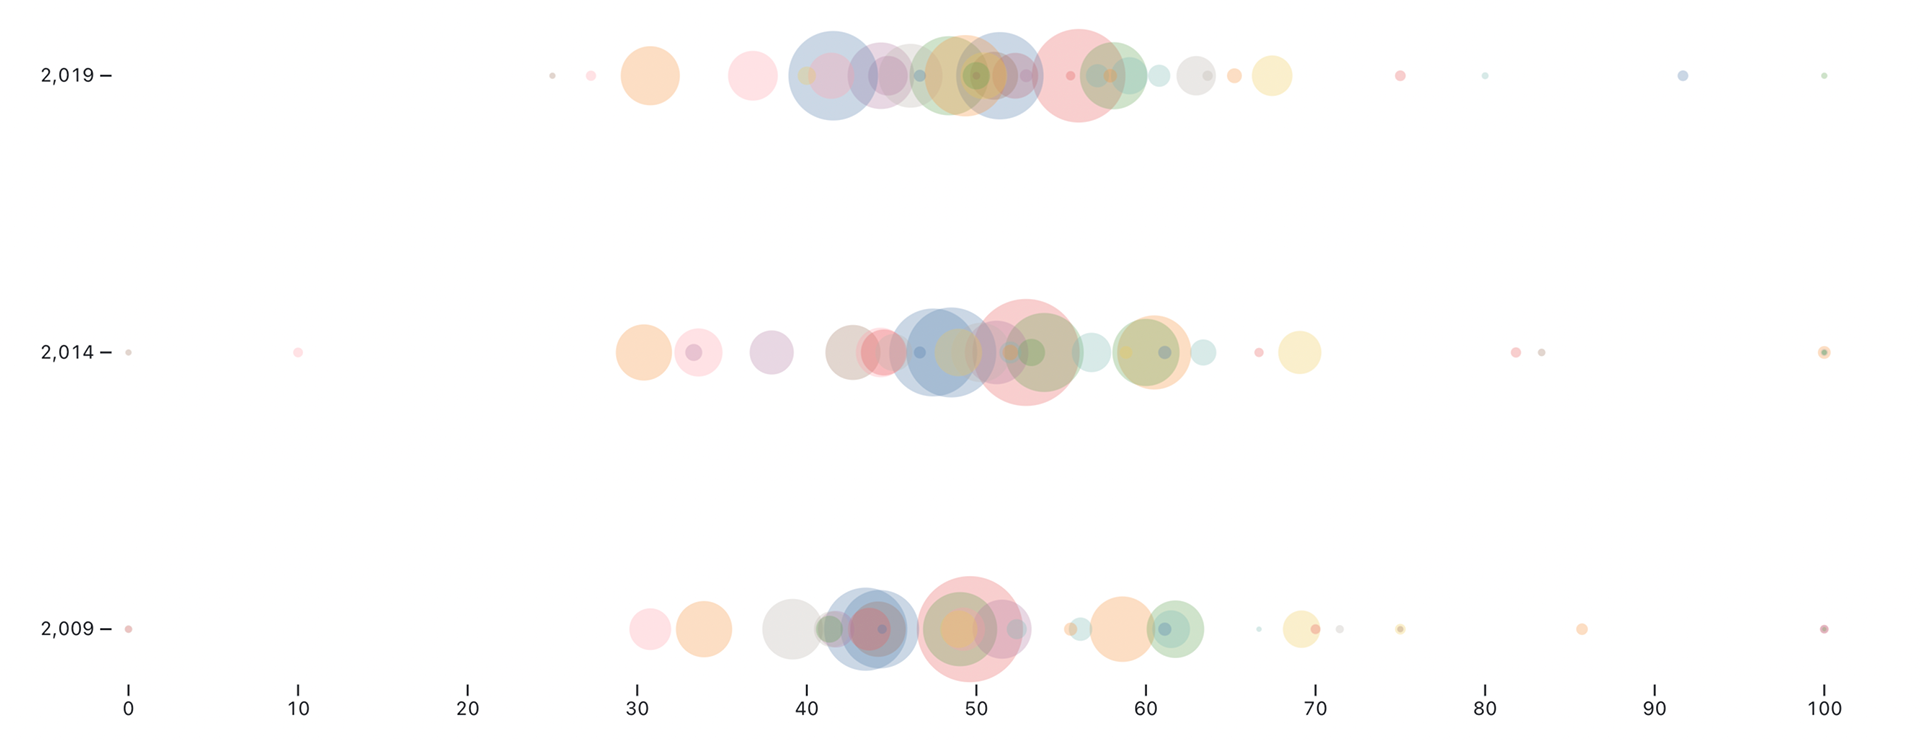
% of candidates with Post Matriculation degrees, different colors for different states
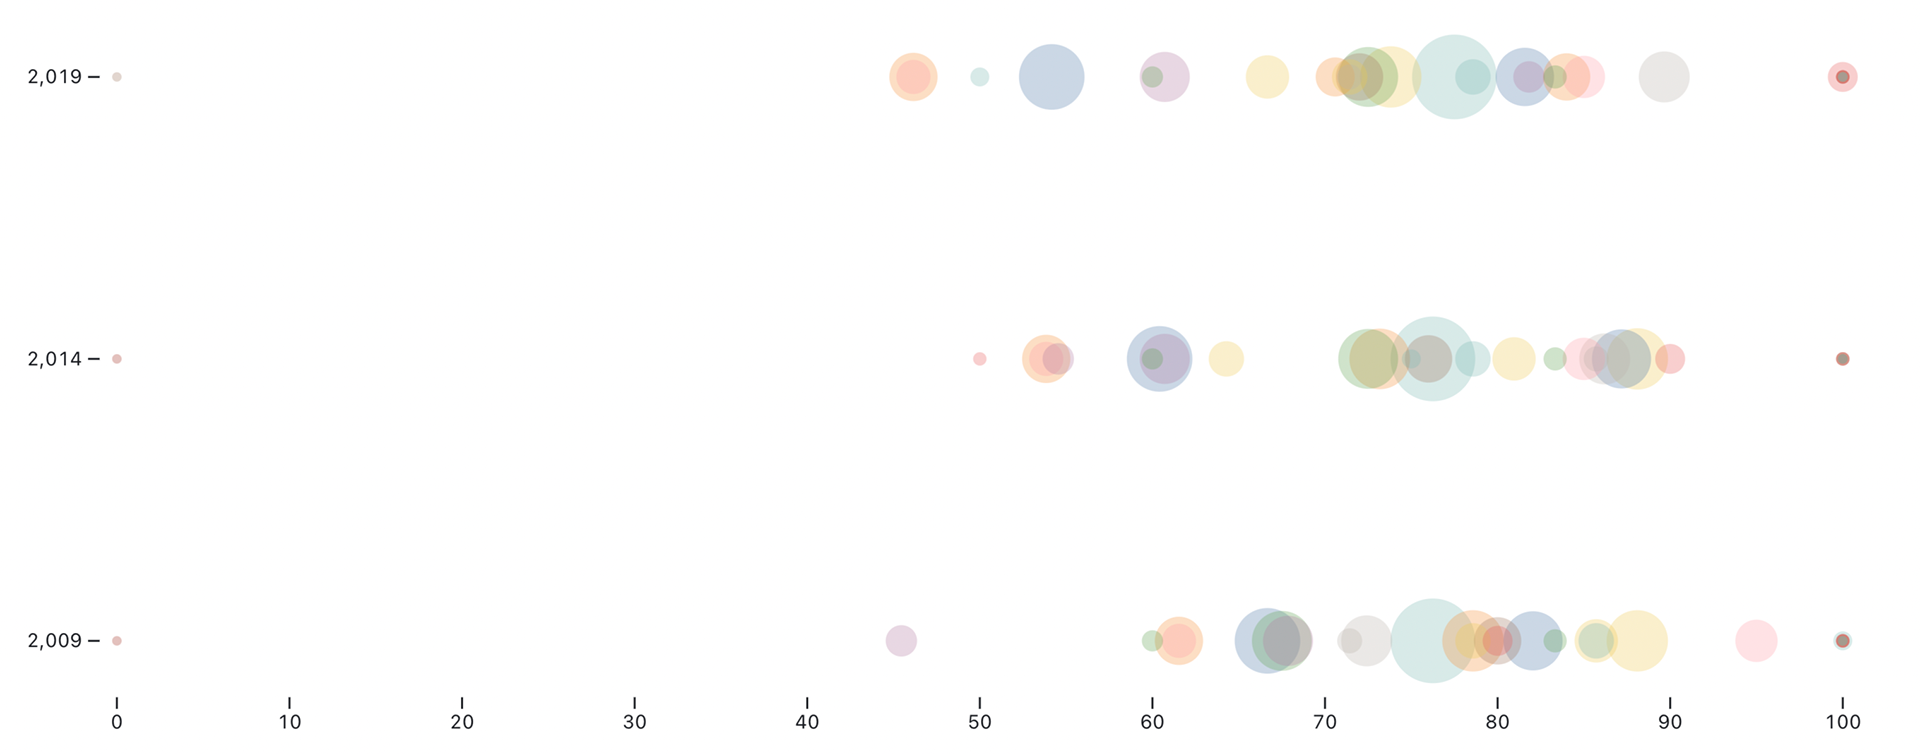
% of MPs with post matriculation degree, different colors for different states
"Remember: things can be bad, and getting better."
~ Hans Rosling
~ Hans Rosling
P.S.: Just 4 of those 140 8th Pass Candidates ultimately won the elections.
A more interactive and detailed version of the same story can be found here.
*