The availability of a large gamut of information has led to a reduced attention span of people. Due to this, we have seen the rise of mobile applications like Inshorts, which provide news in less than 60 words. This inspired me to embark on the journey of depicting the news in a graphical way. It started in 2018 with one news in three days and has grown approximately three folds since then to one news per day.
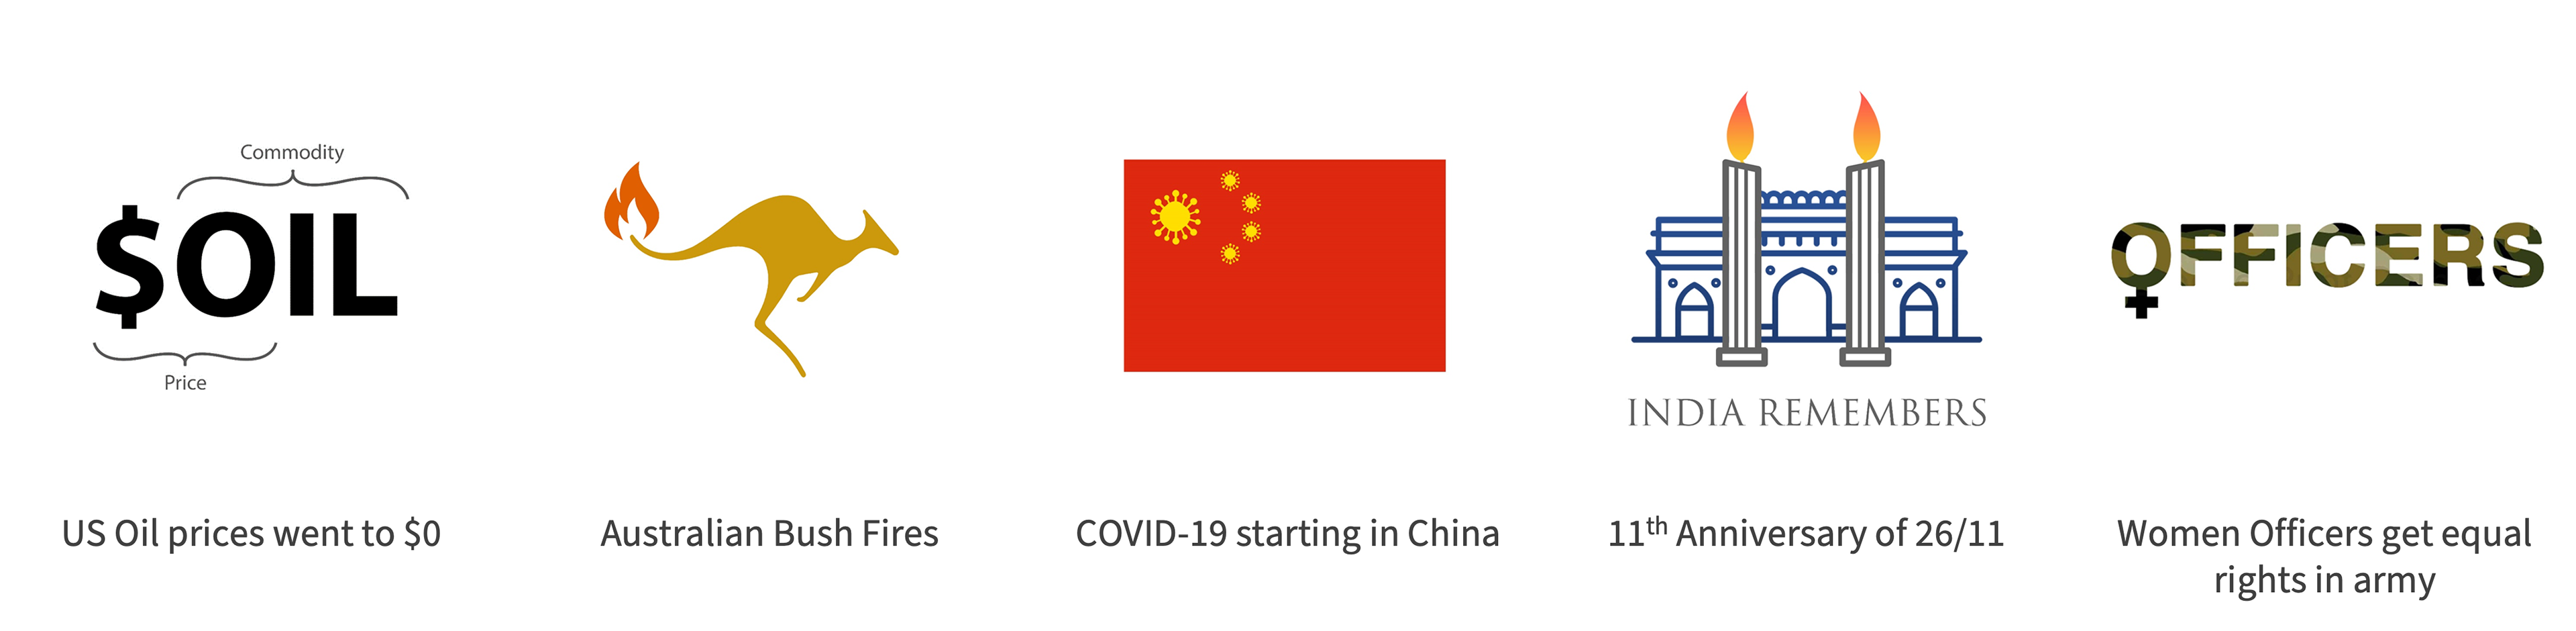
Following are some of the news that I have covered. All of them can be found on @Thebrokenhash
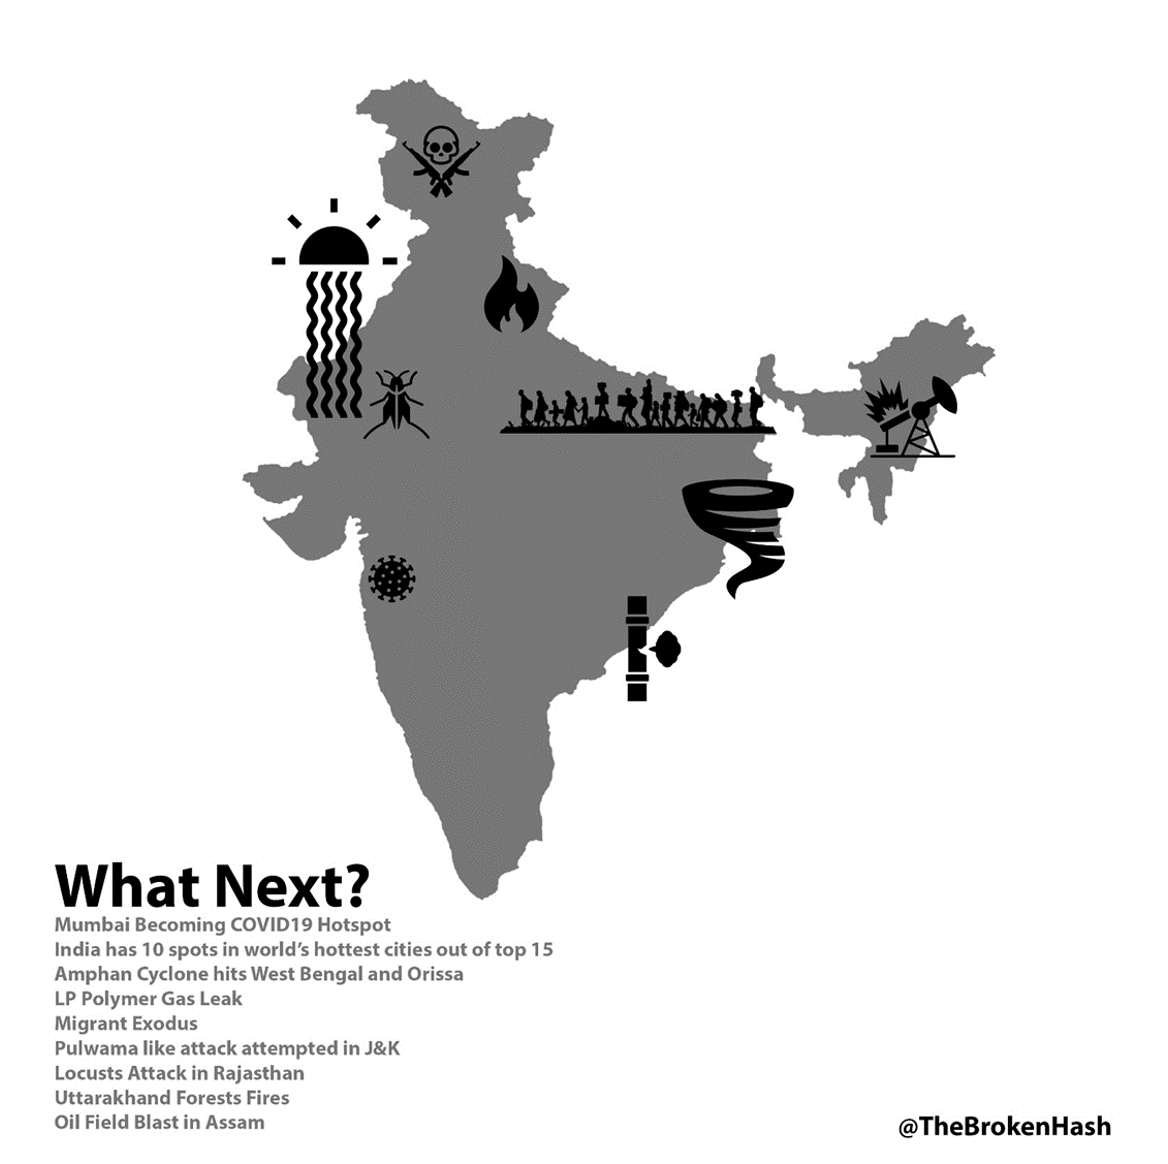
DIsasters faced by India in 2020
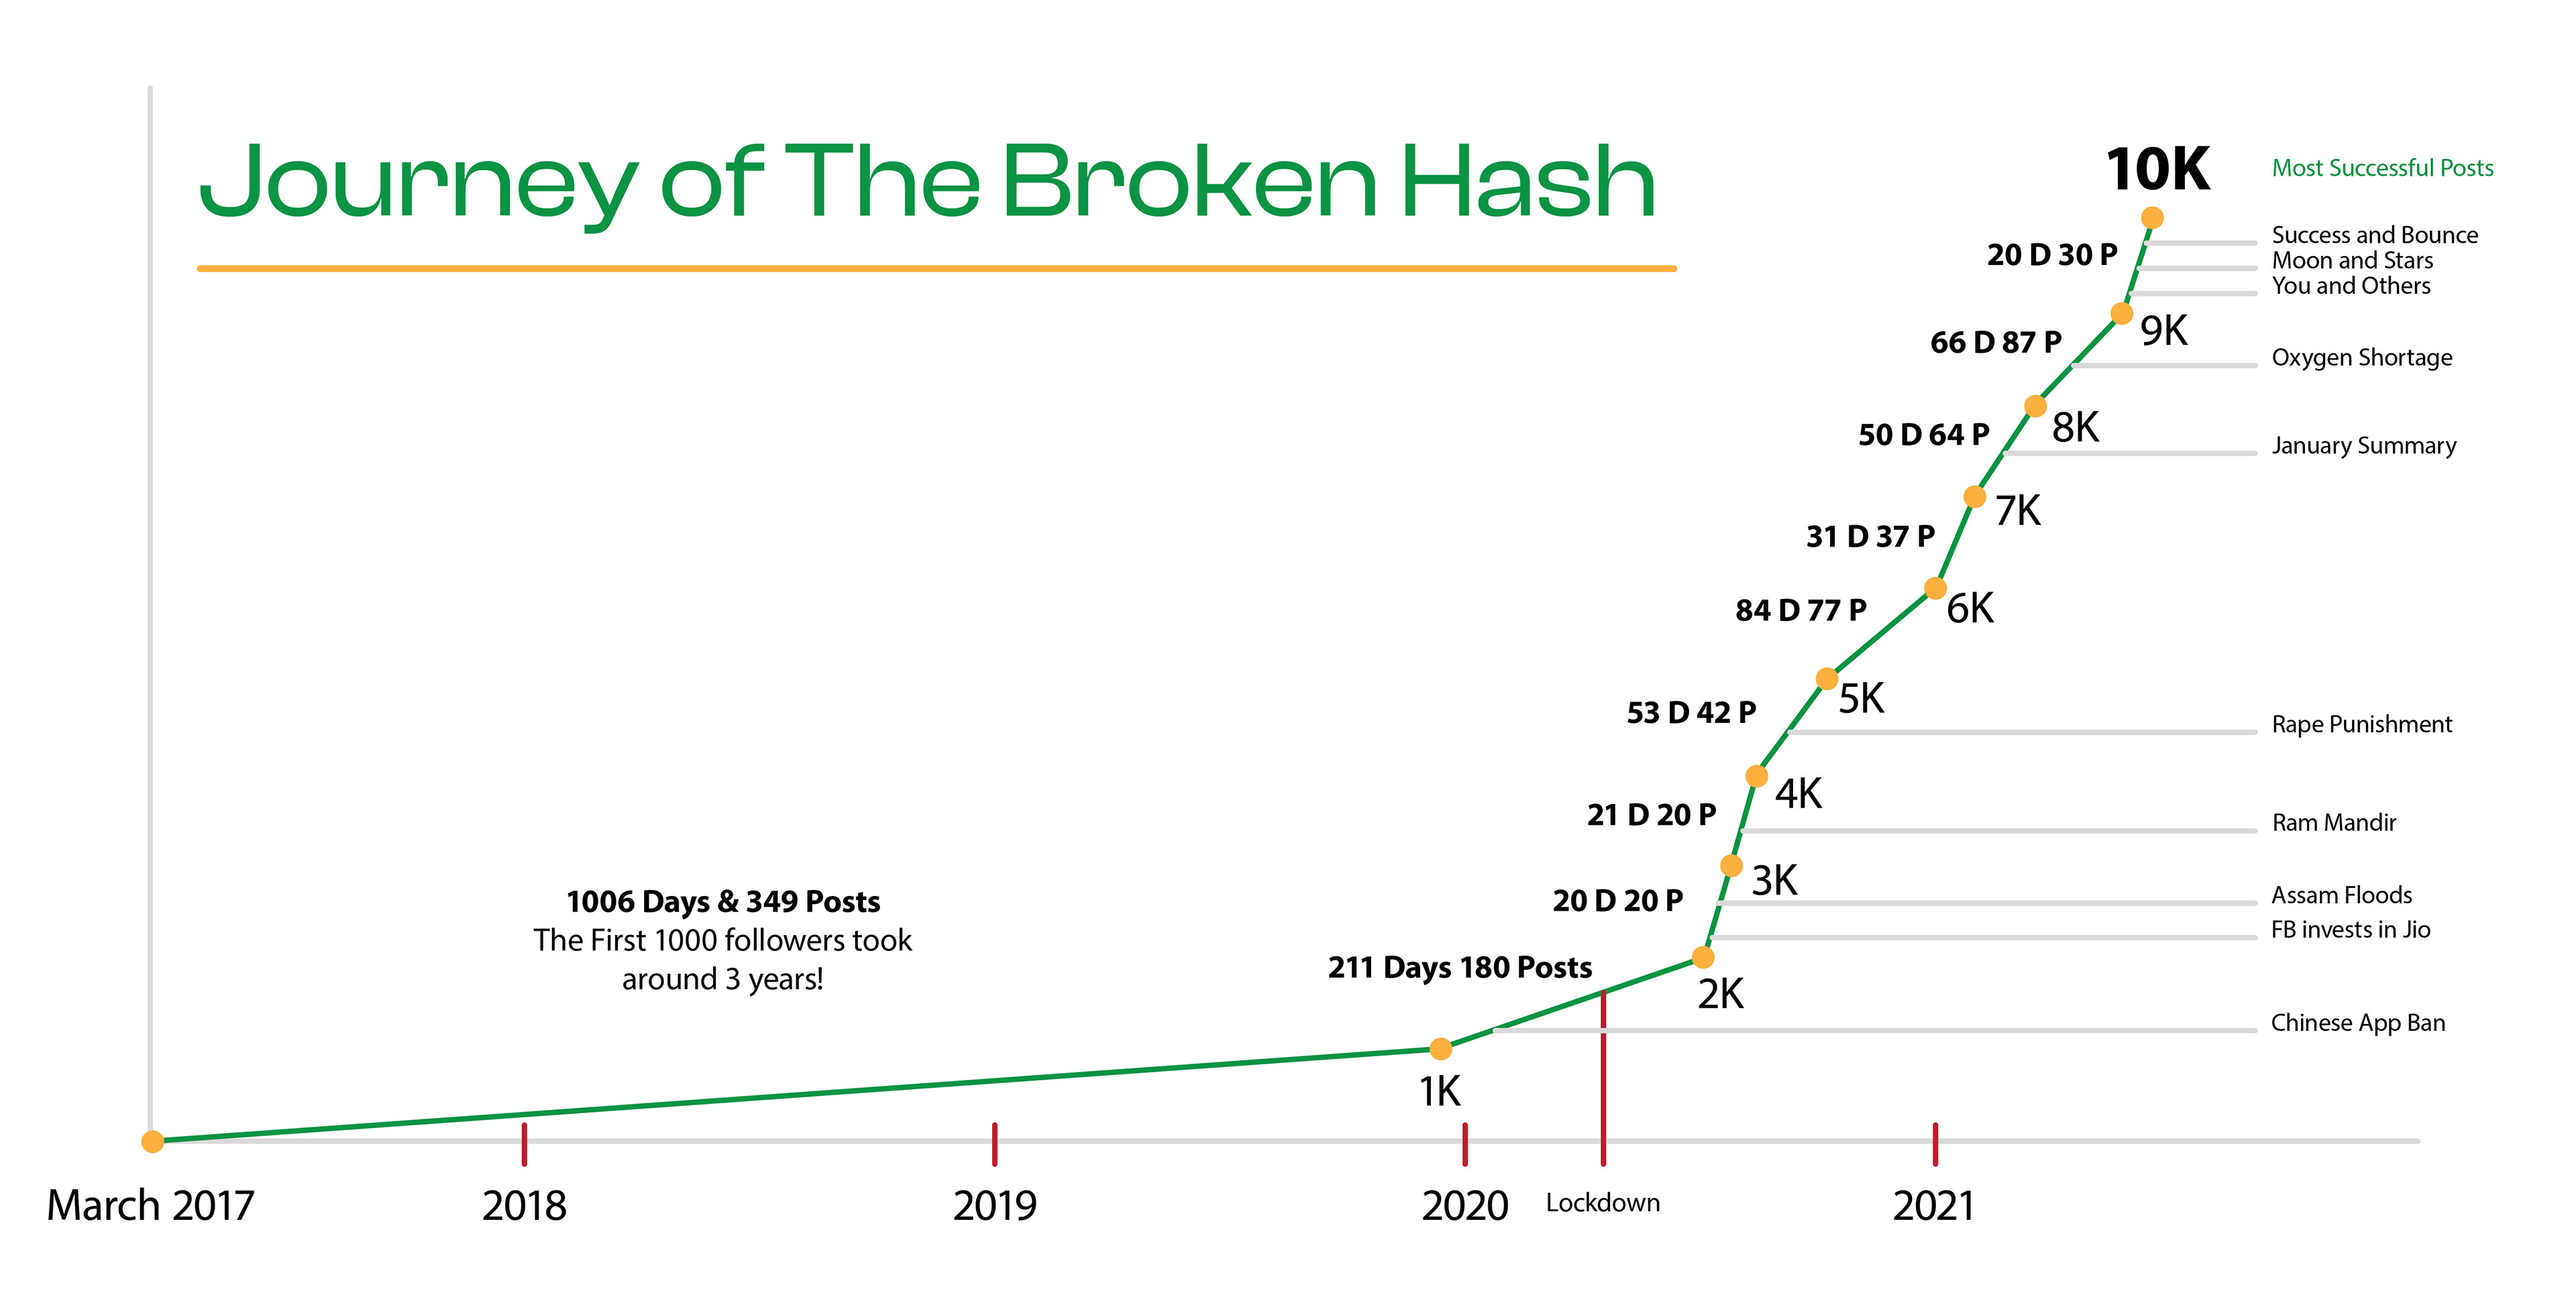
This small effort which started on an Instagram page, @TheBrokenHash showed an exponential rise in followers after the COVID-19 lockdown.
In June 2021, reached 10,000 followers. This is what the journey looked like from the very start of the page.
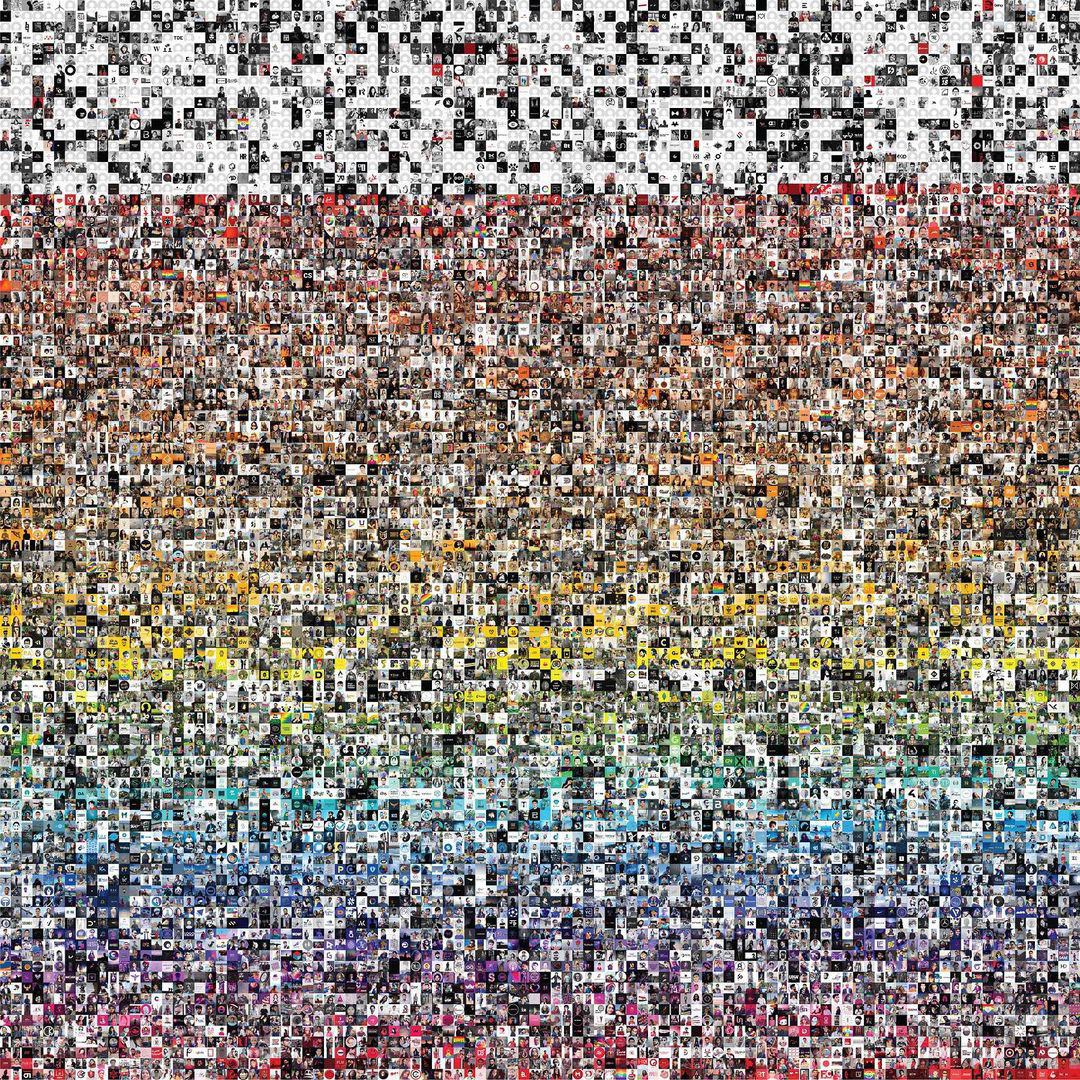
After reaching 10K followers I got pretty carried away and decided to celebrate the milestone with all my followers. Yes with all 10,000 of them!
By making a color-coordinated collage of the profile photos of all the followers.
Process
1. Scrapped all the profile picture links into a CSV file using PhantomBuster
2. Wrote a script to download all the images
3. Sorted the images as per their hue values
4. Stiched the images in a line
5. Made a square grid out of the stitched lines
A Point of Conversation
Unlike all other celebratory posts where brands just put out a 'thank you' and the comment section is flooded with 'Congratulations' this attempt served as a point where followers engaged and tried to find themselves. With more than 200 comments, this post is the most commented post.
Love it Received
Following are some of my favorite comments on the collage:
"This was (a) real tribute"
~ @mroffiicer
~ @mroffiicer
"I found myself 😍 This is amazing. Congrats @thebrokenhash 🎉"
~ @_that_curious_girl
~ @_that_curious_girl
"1. Lucky
2. Very Lucky
3. People who found themselves here"
~ @ ibn_saiyal
2. Very Lucky
3. People who found themselves here"
~ @ ibn_saiyal
The main post can be found here.