Process
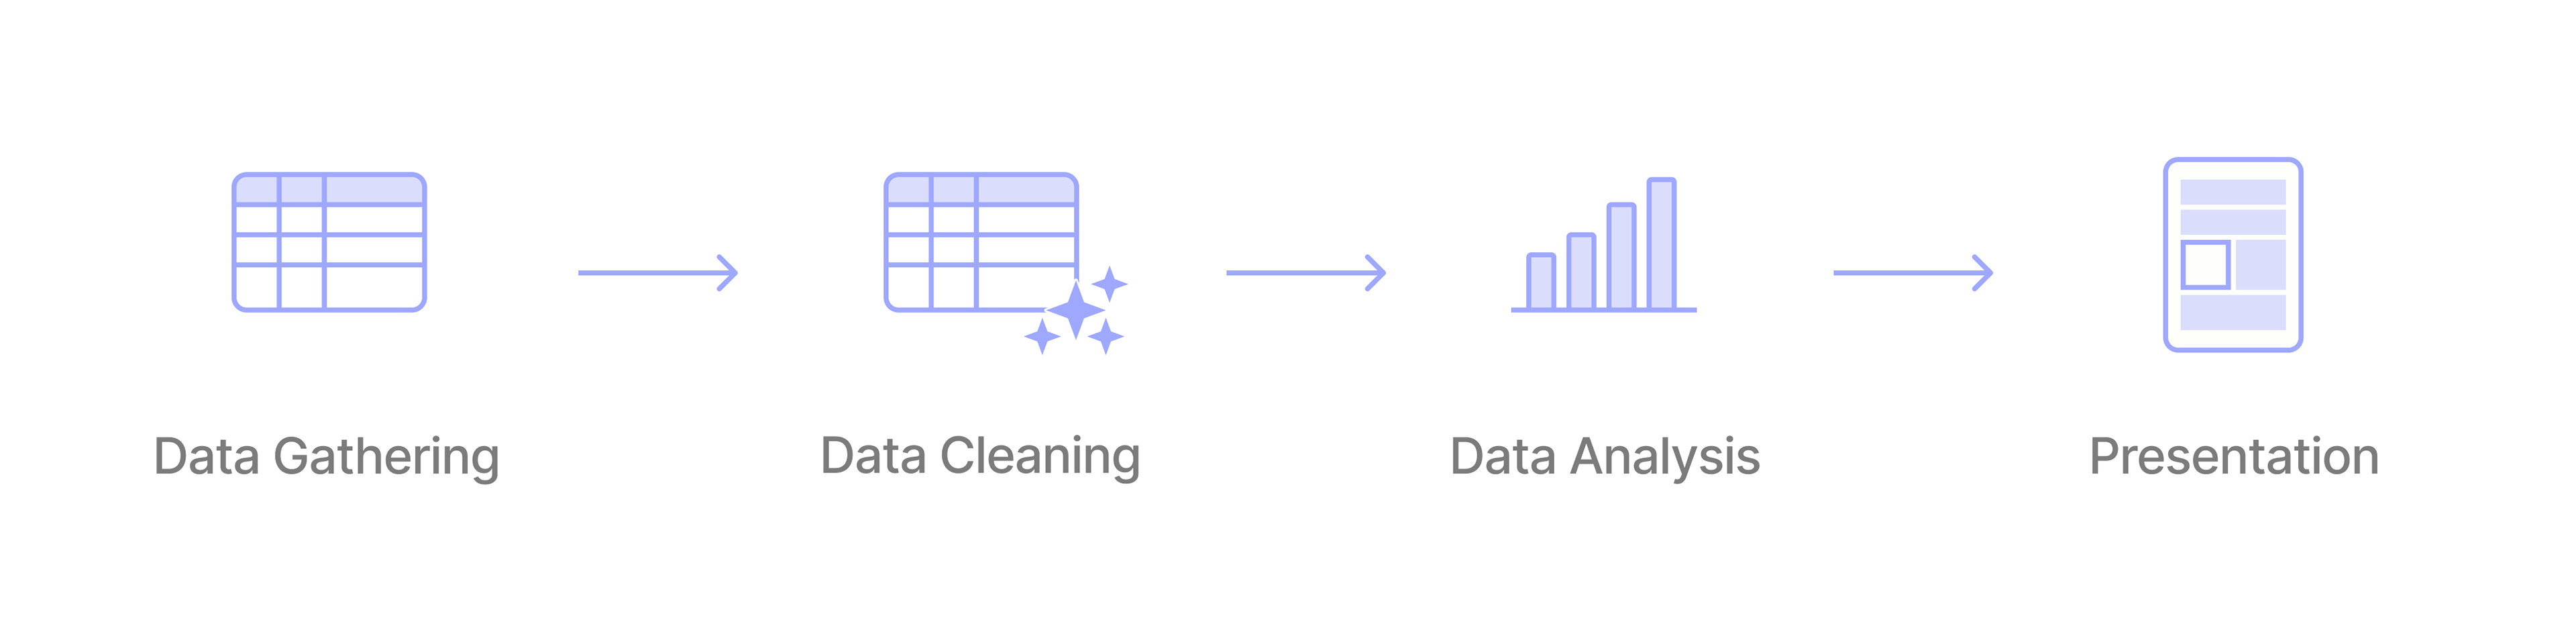
Data Gathering
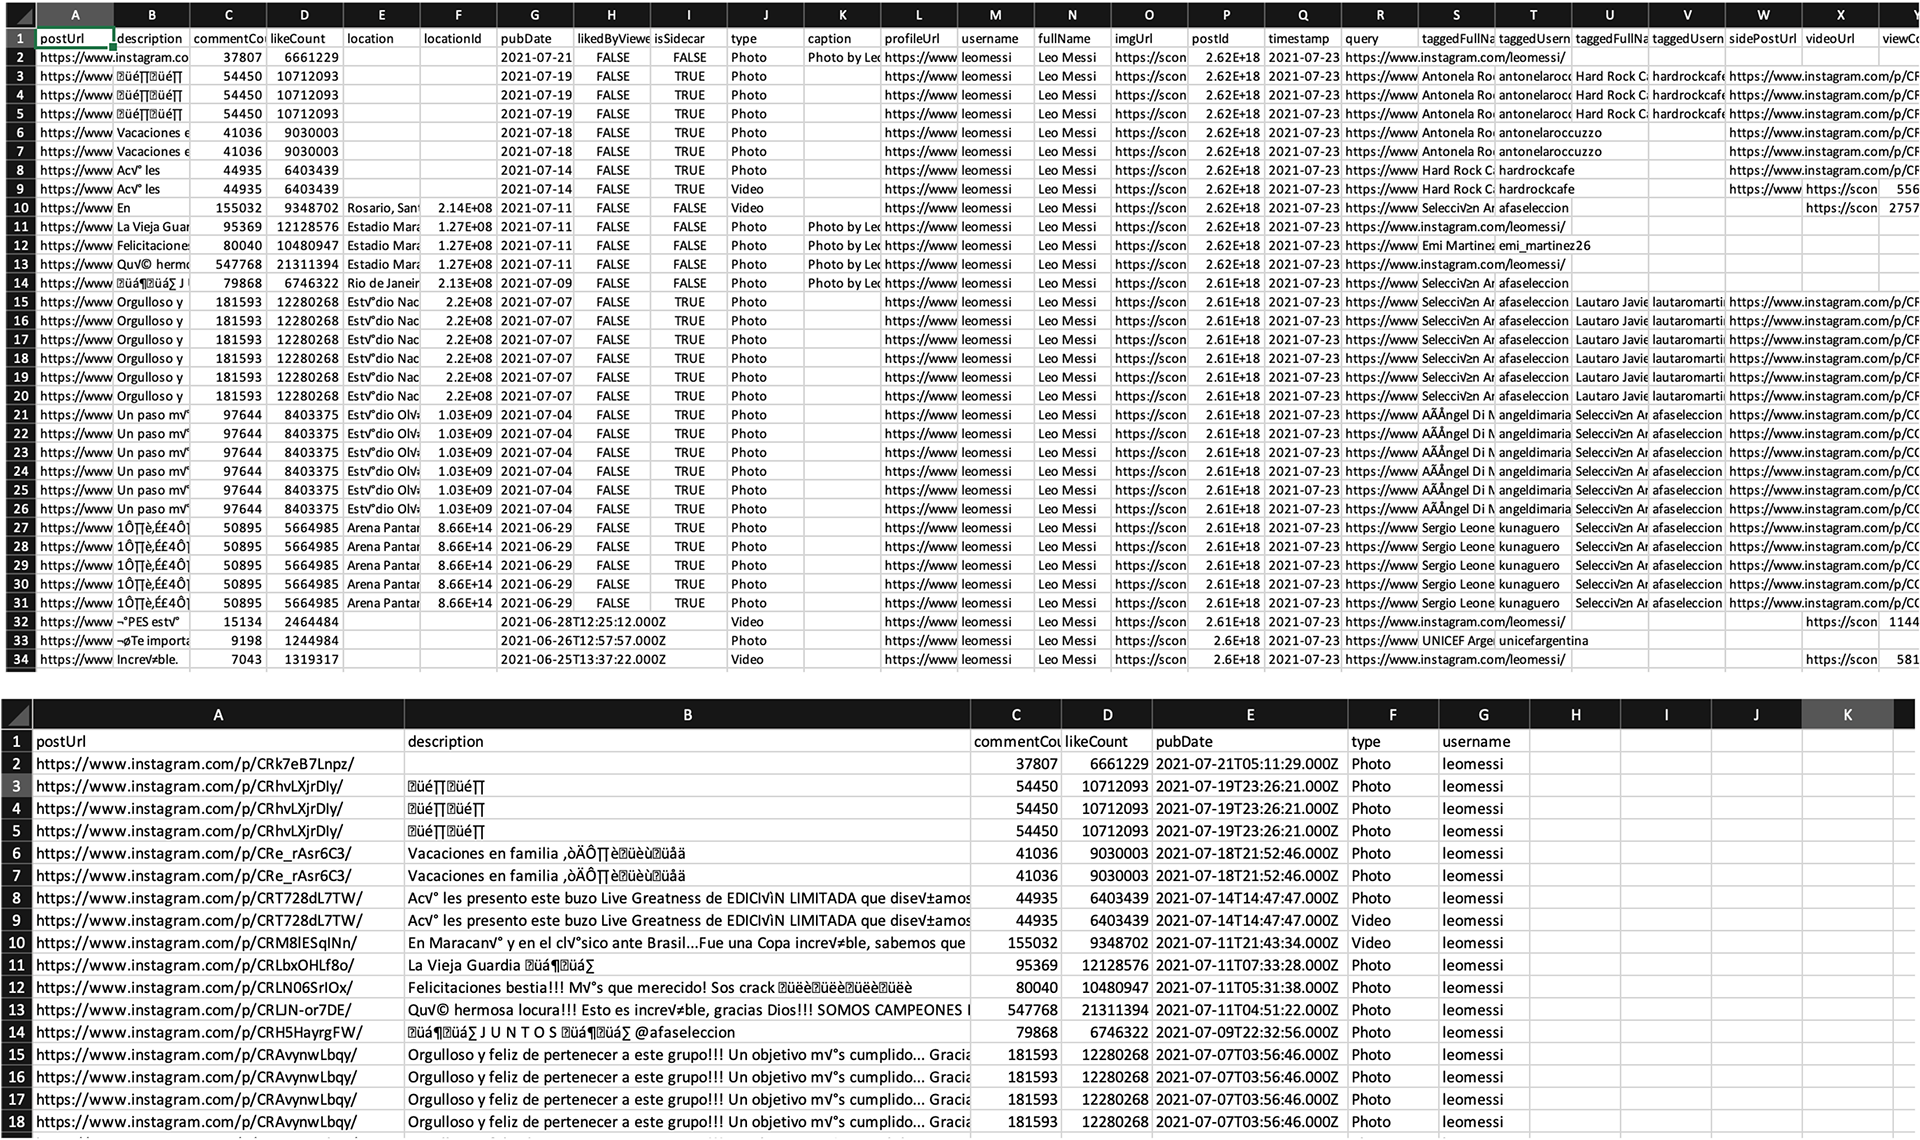
Started by using selenium framework, to collect data from Instagram. Selenium was chosen because it allows you to click while scraping. We were able to collect data but the process was taking a long time.
We further used ‘Phantombuster’ to get the data faster
Data Cleaning
Data was then cleaned in excel and further analyzed in Python using Plotly and WordCloud modules in Google Collaboratory
Data Analysis
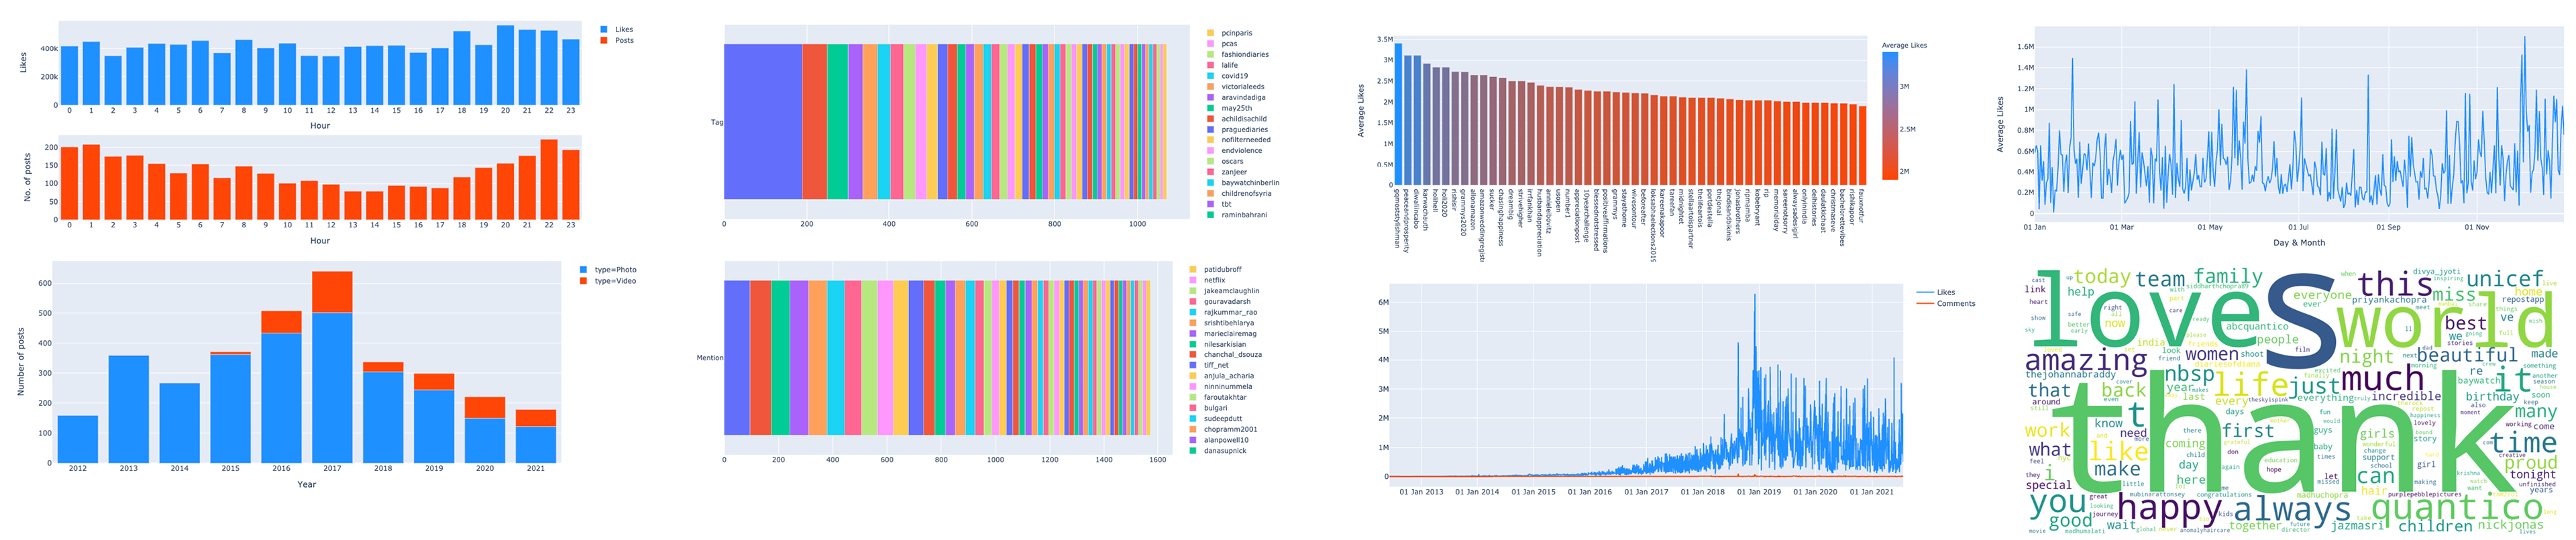
The following 8 graphs were plotted:
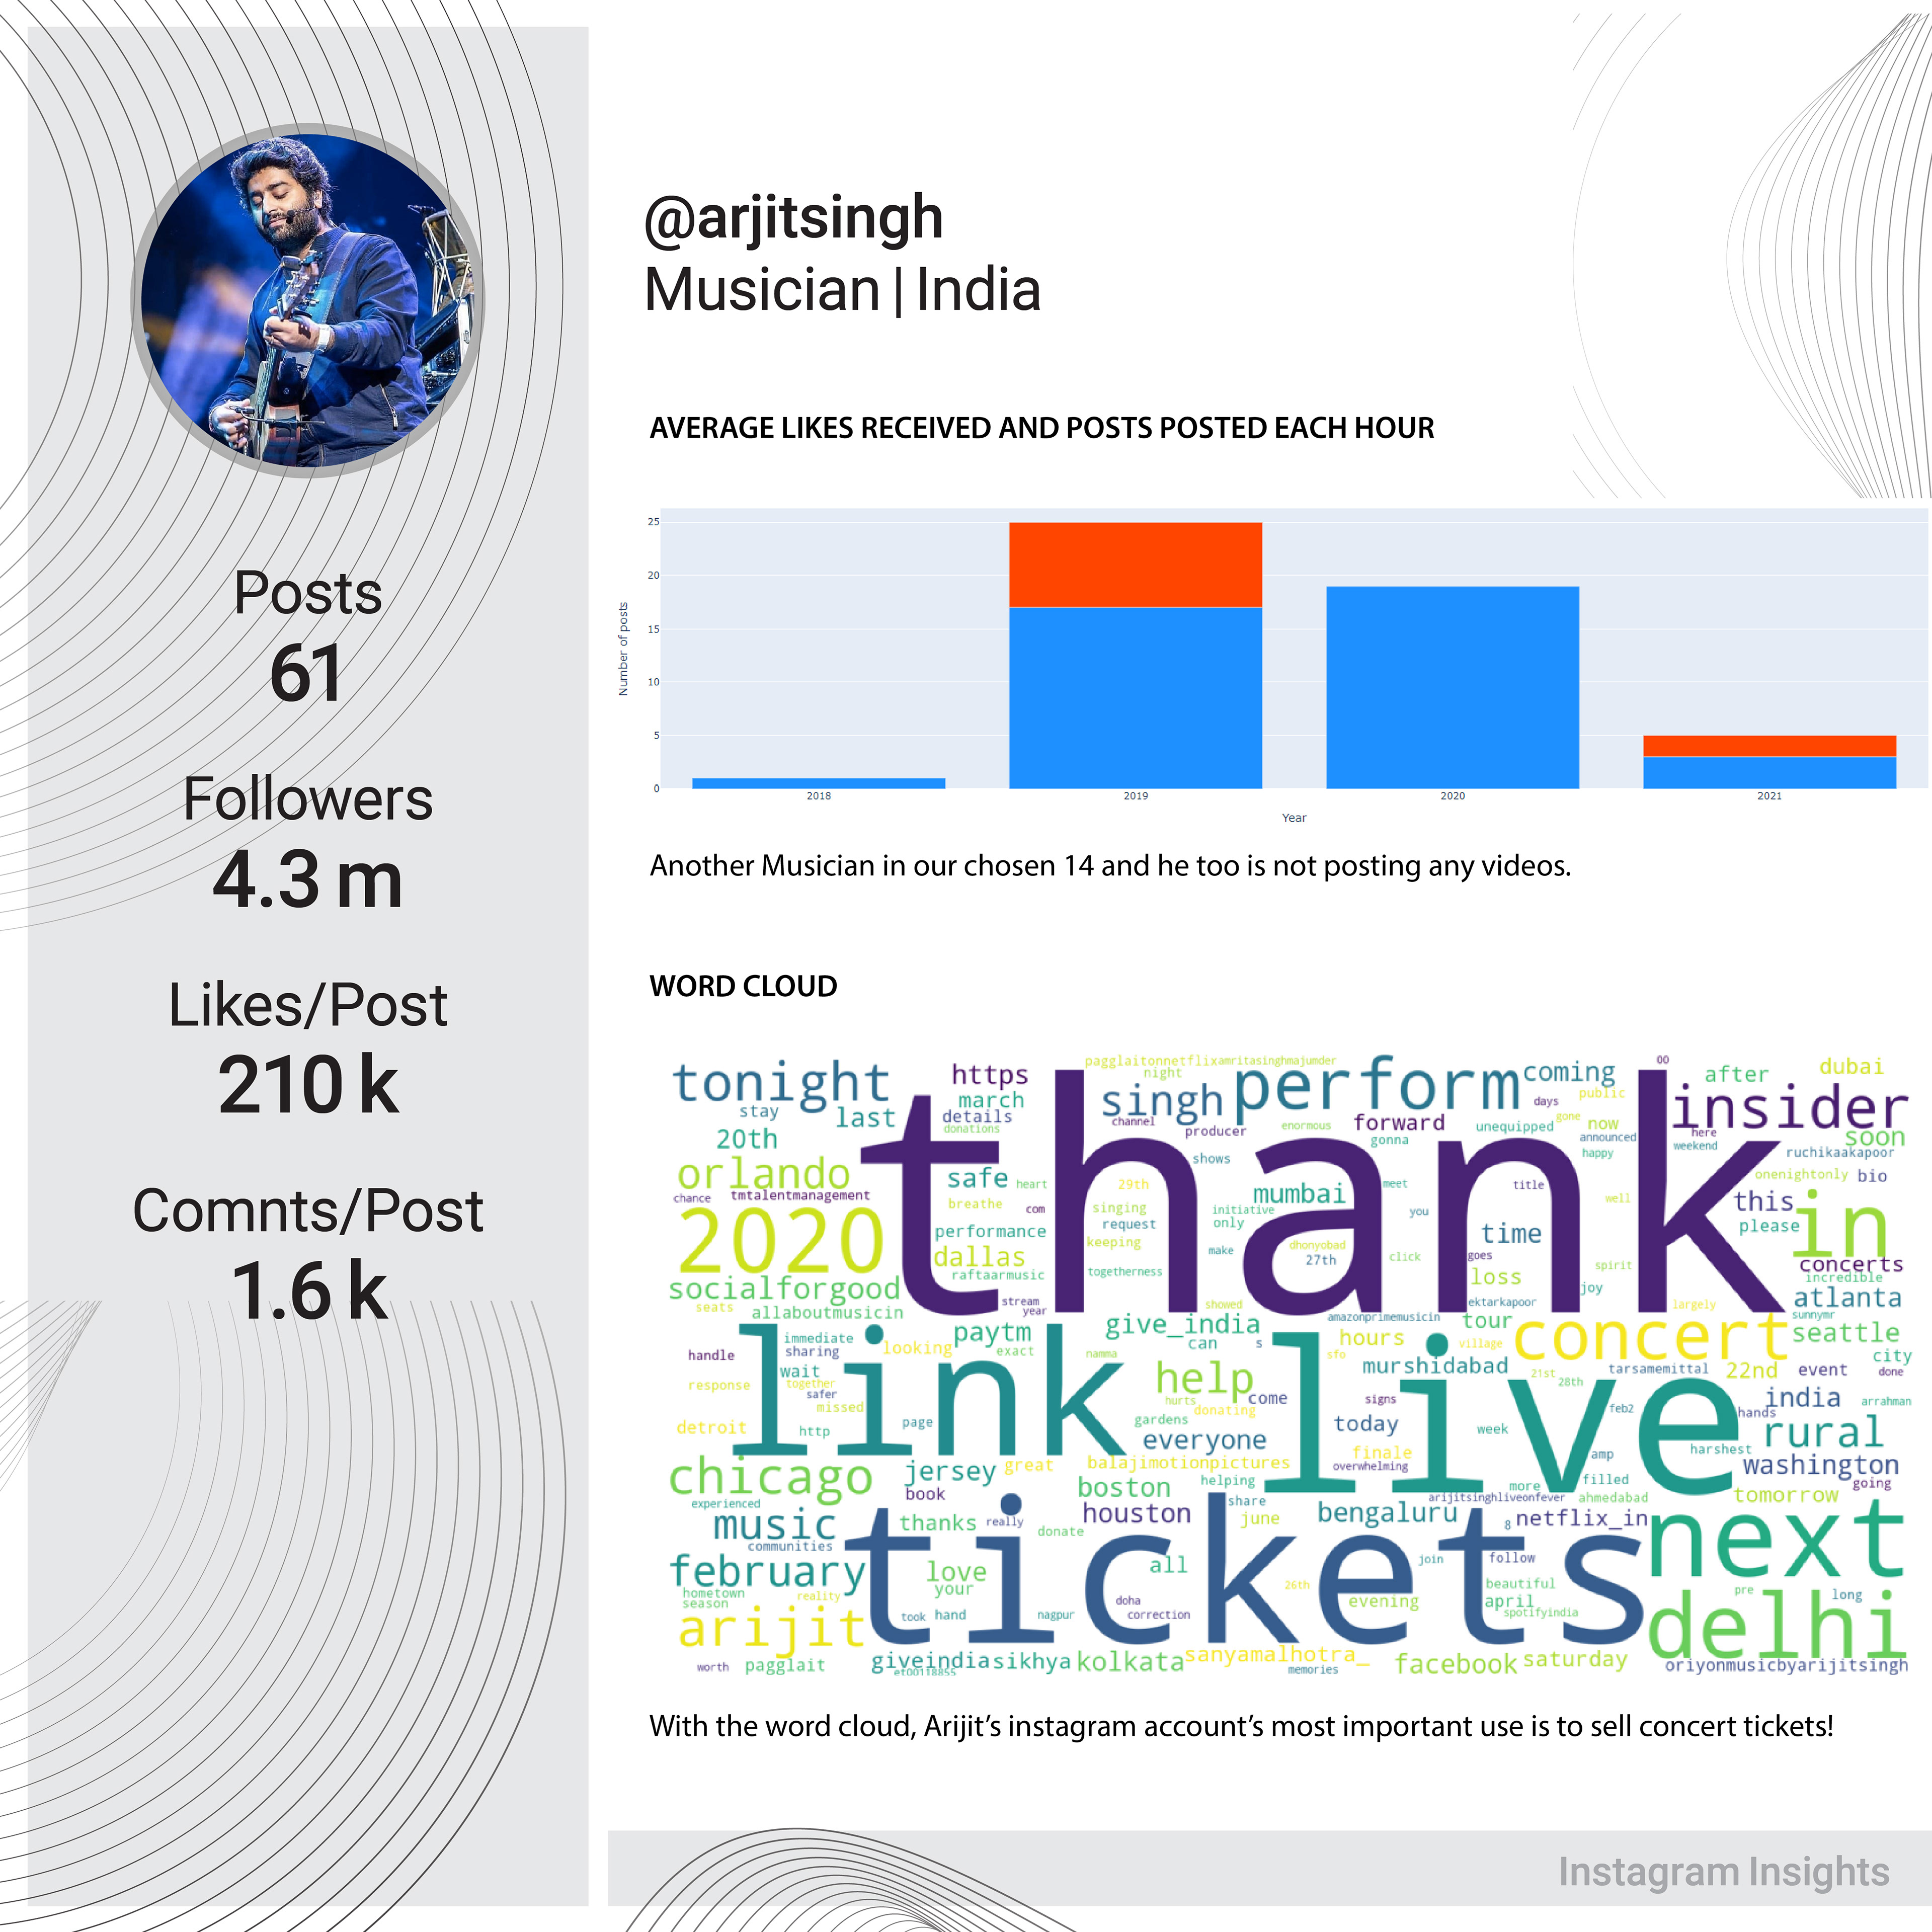
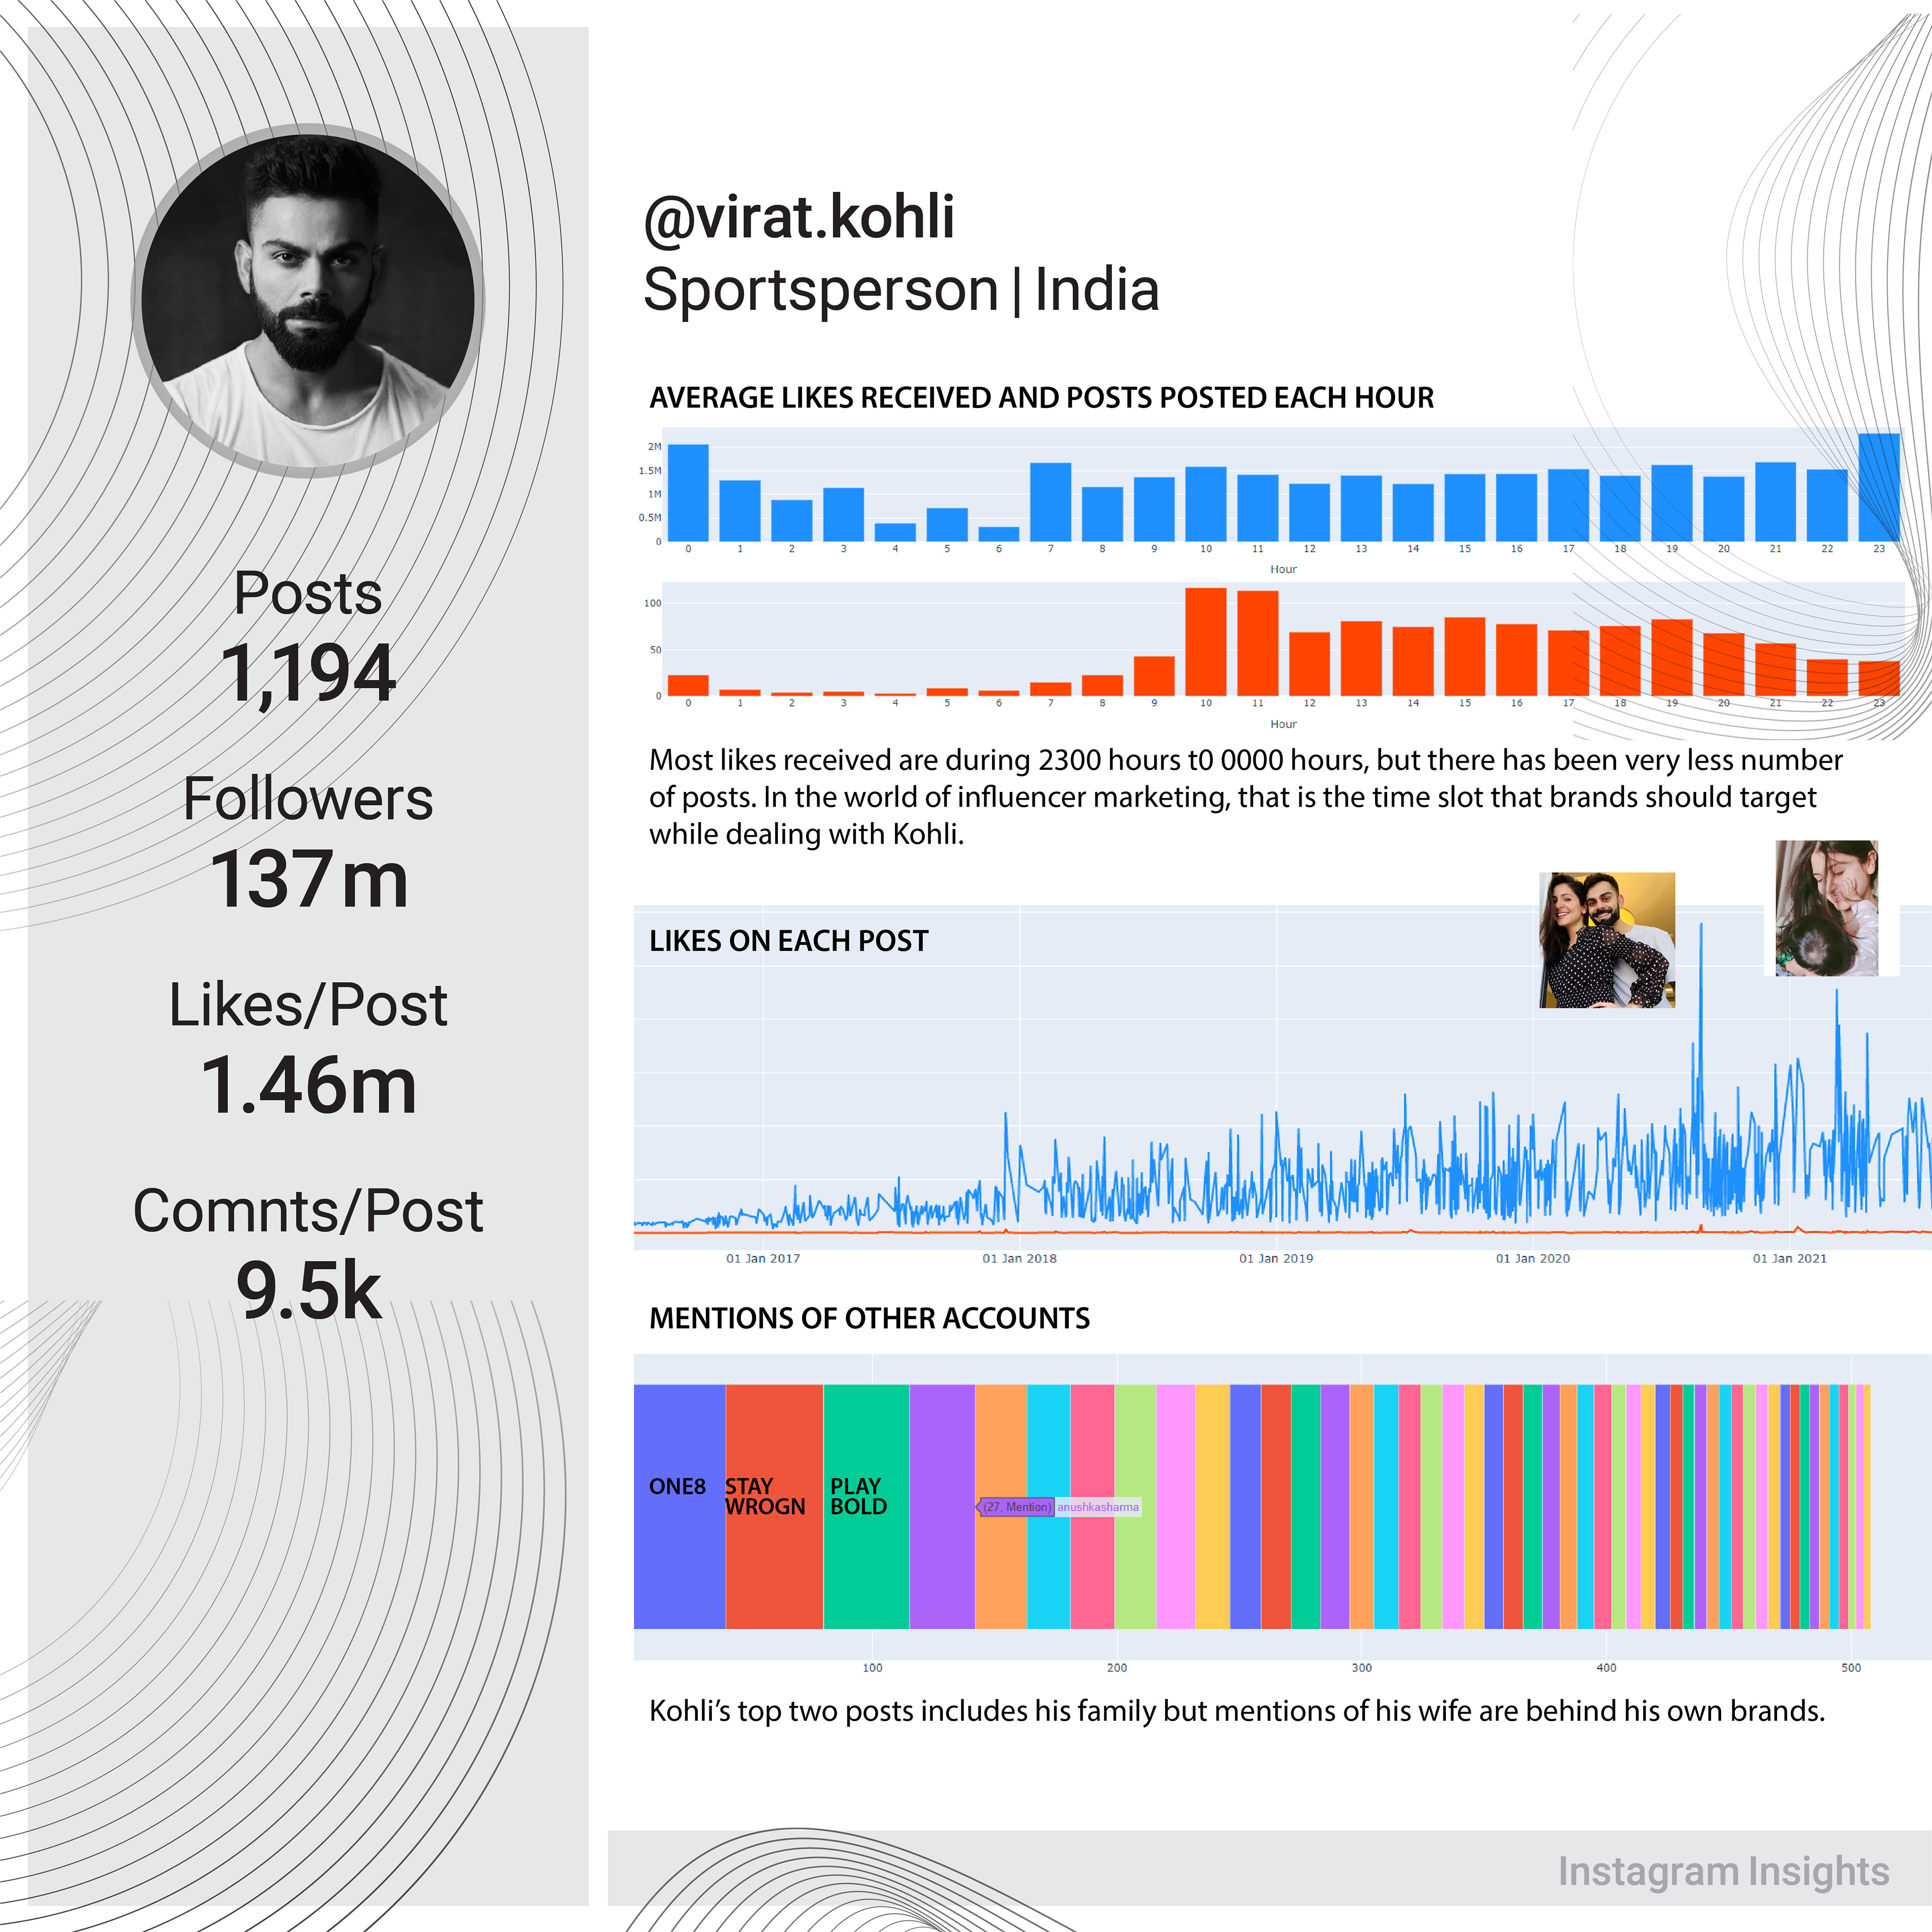
1. Number of posts posted, and average likes received each hour
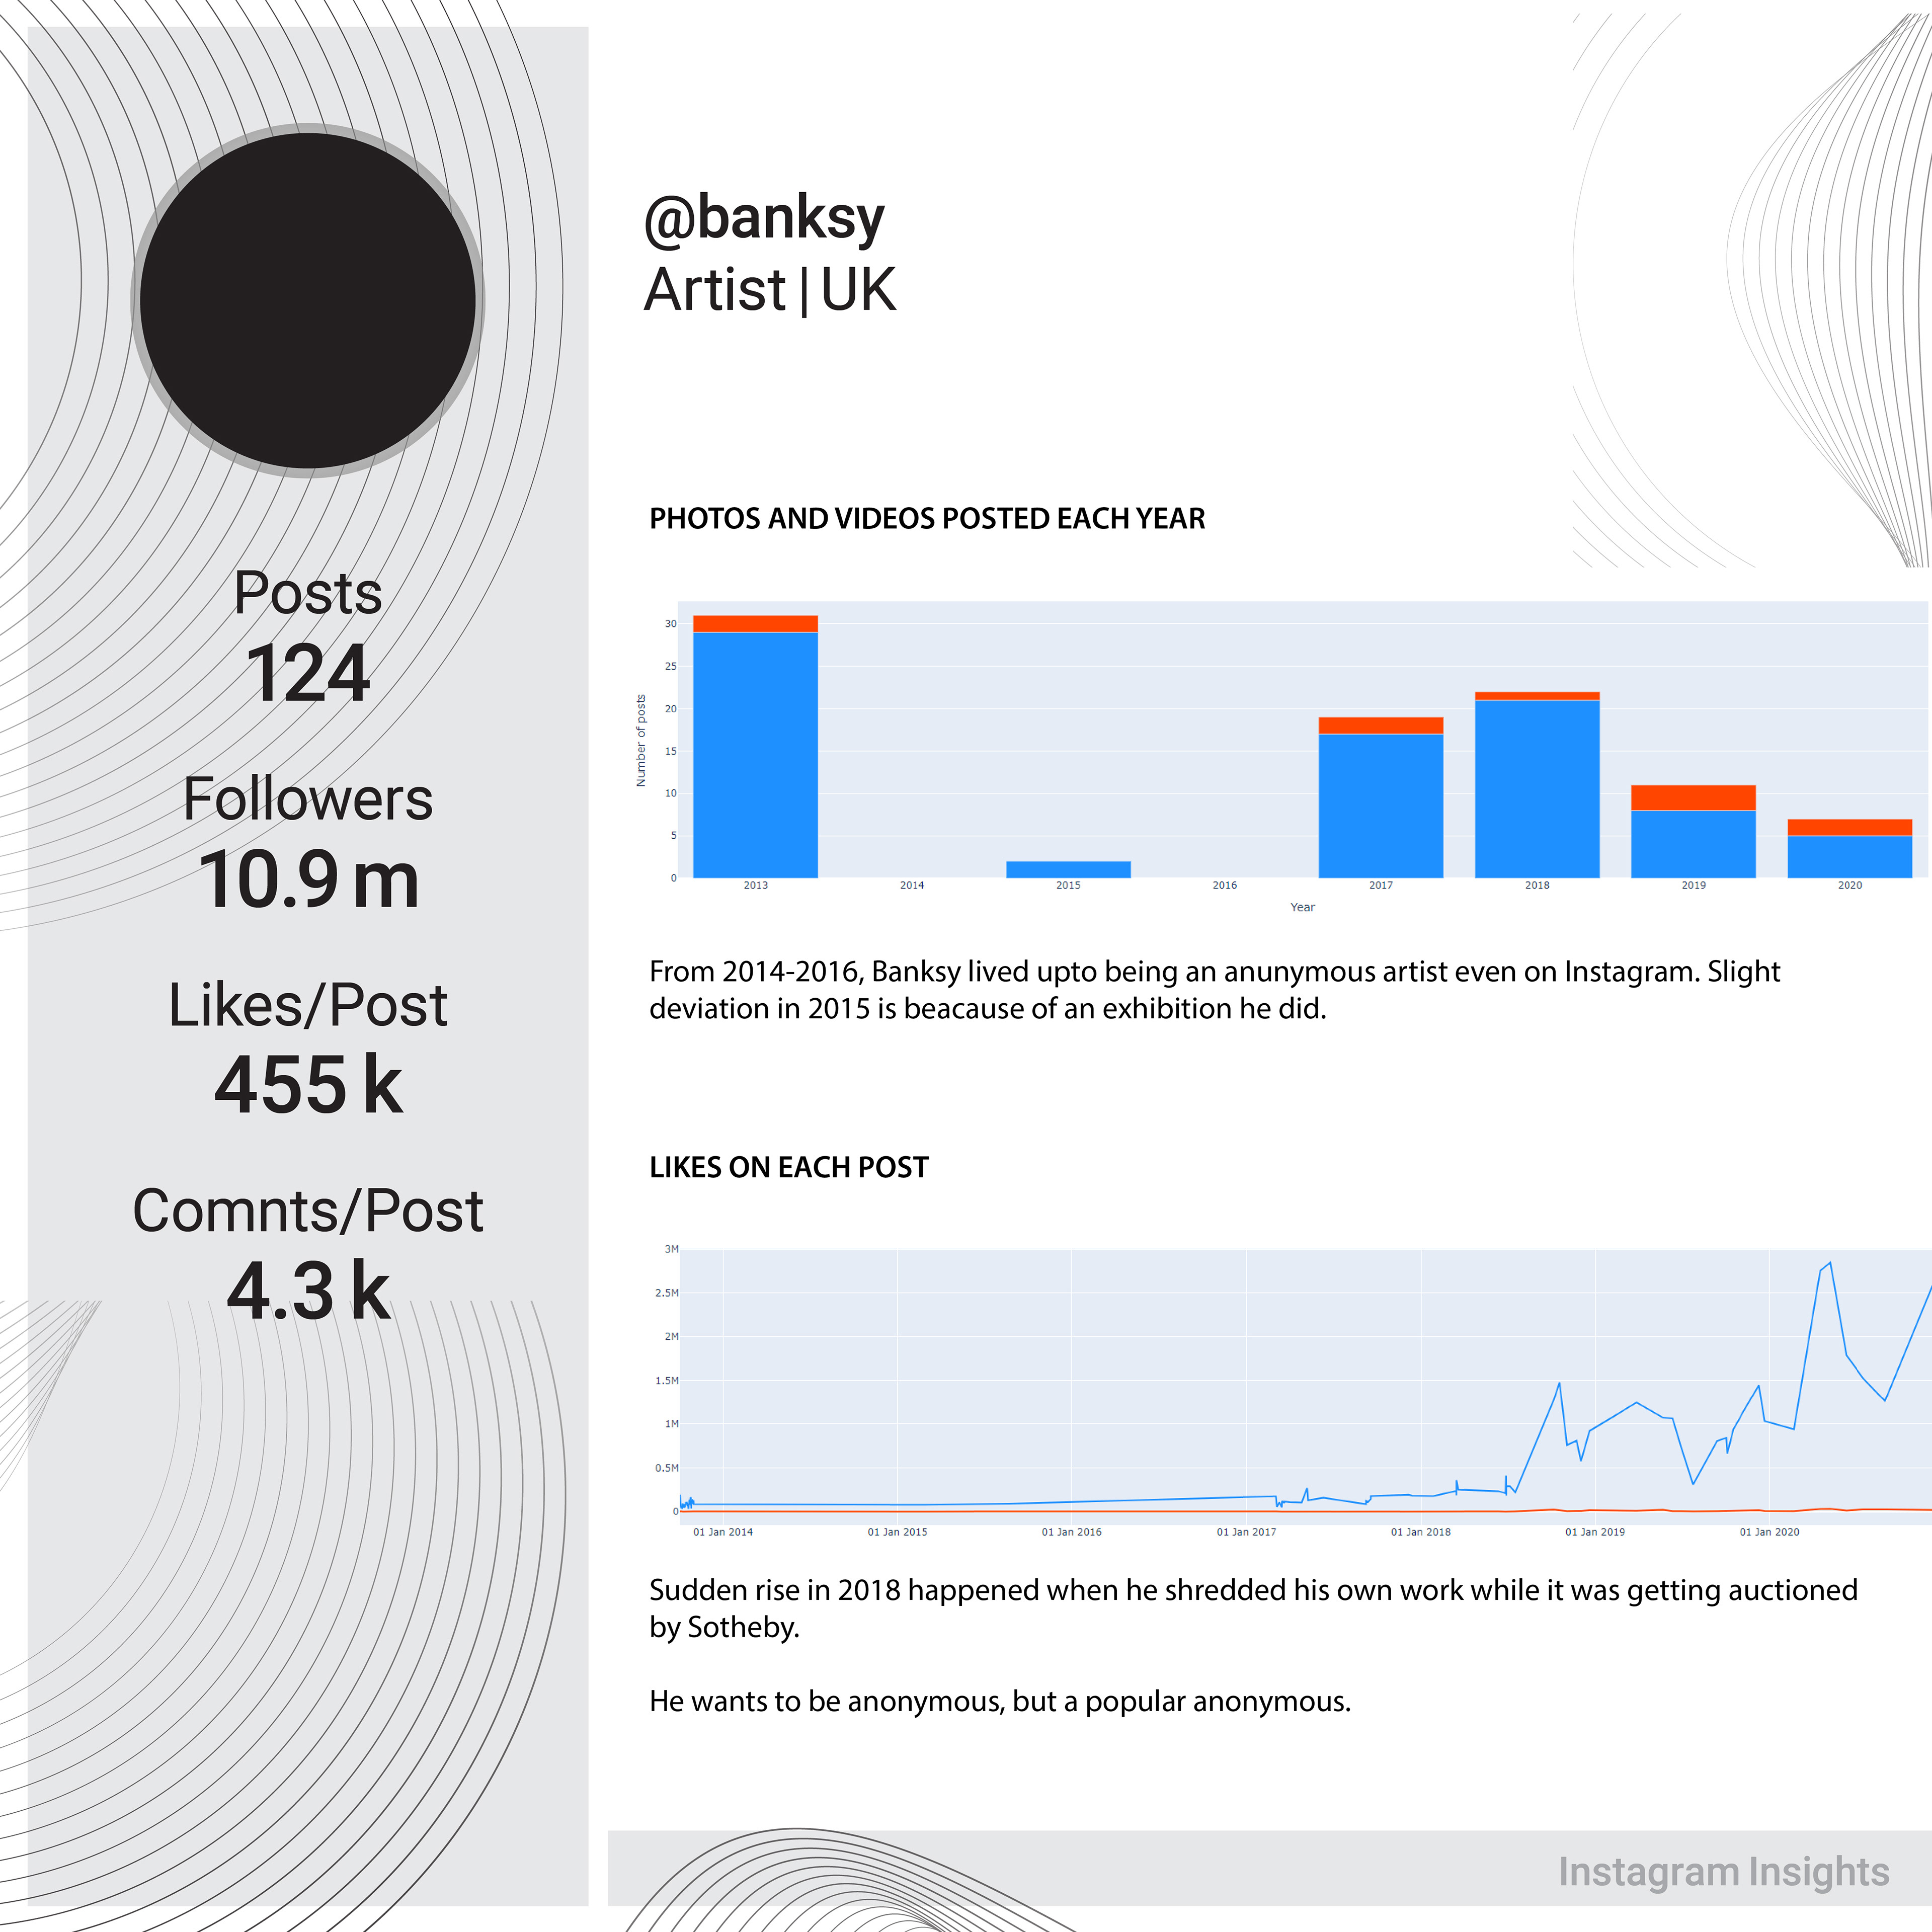
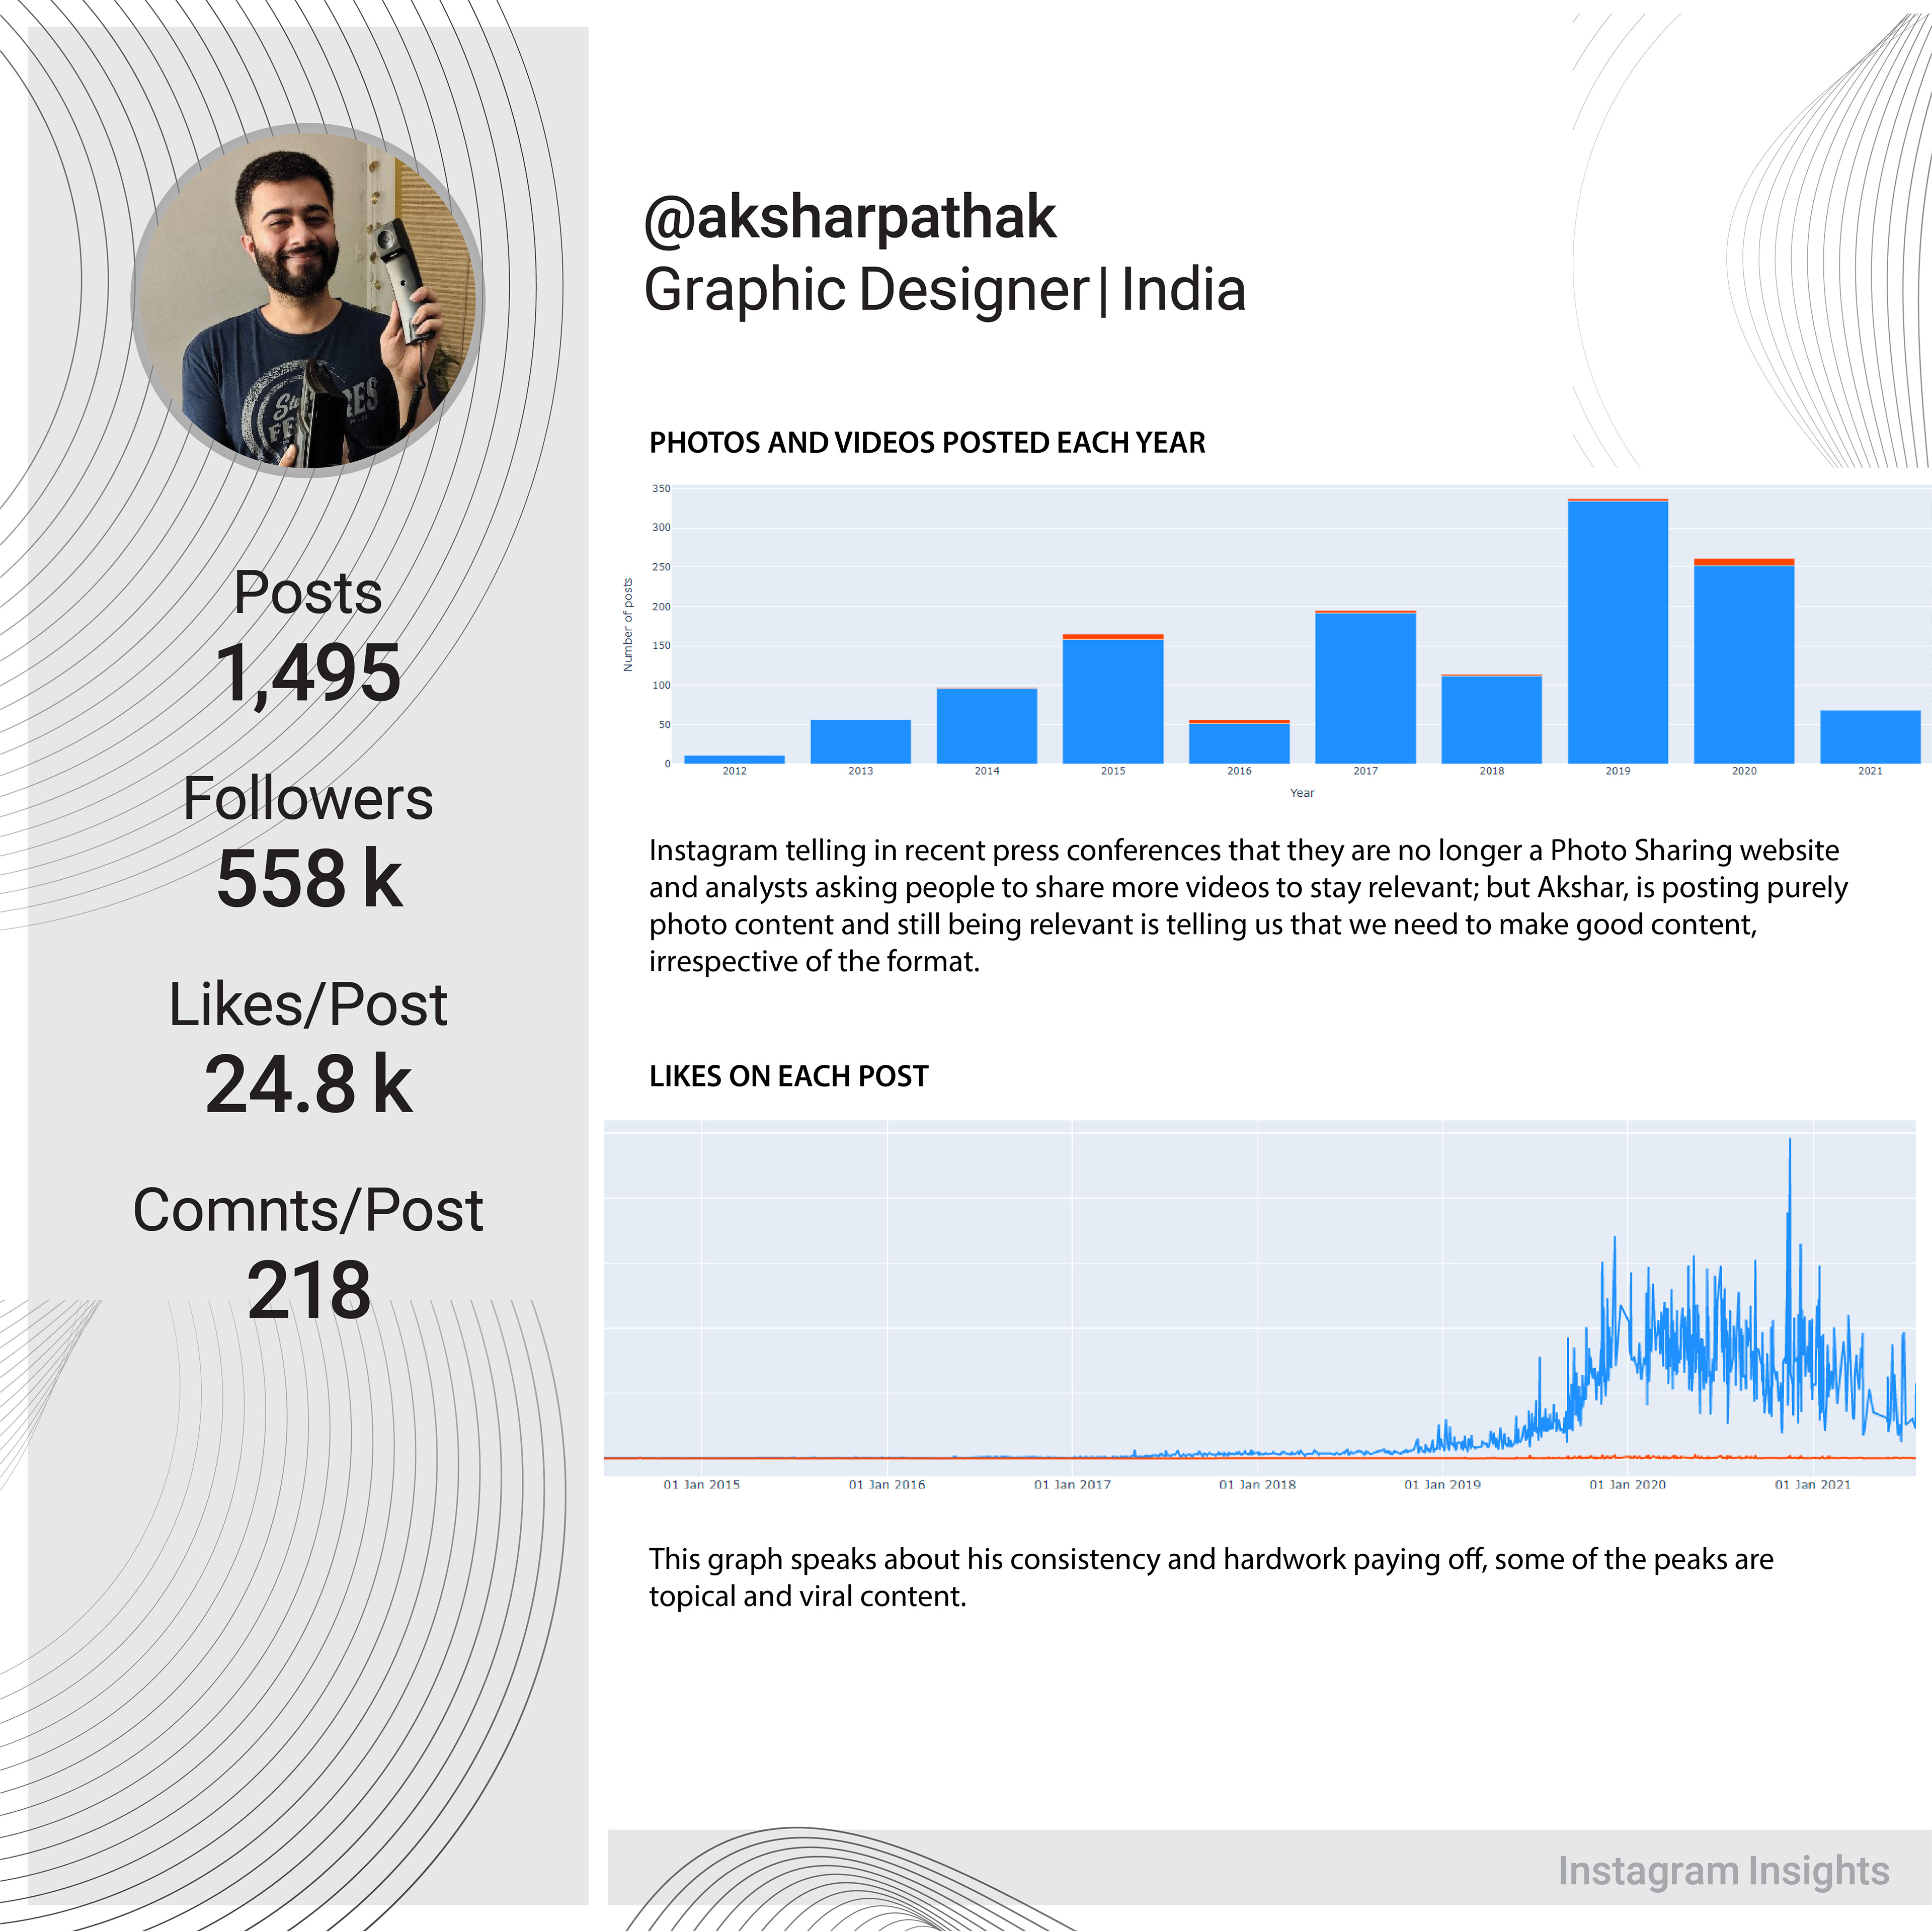
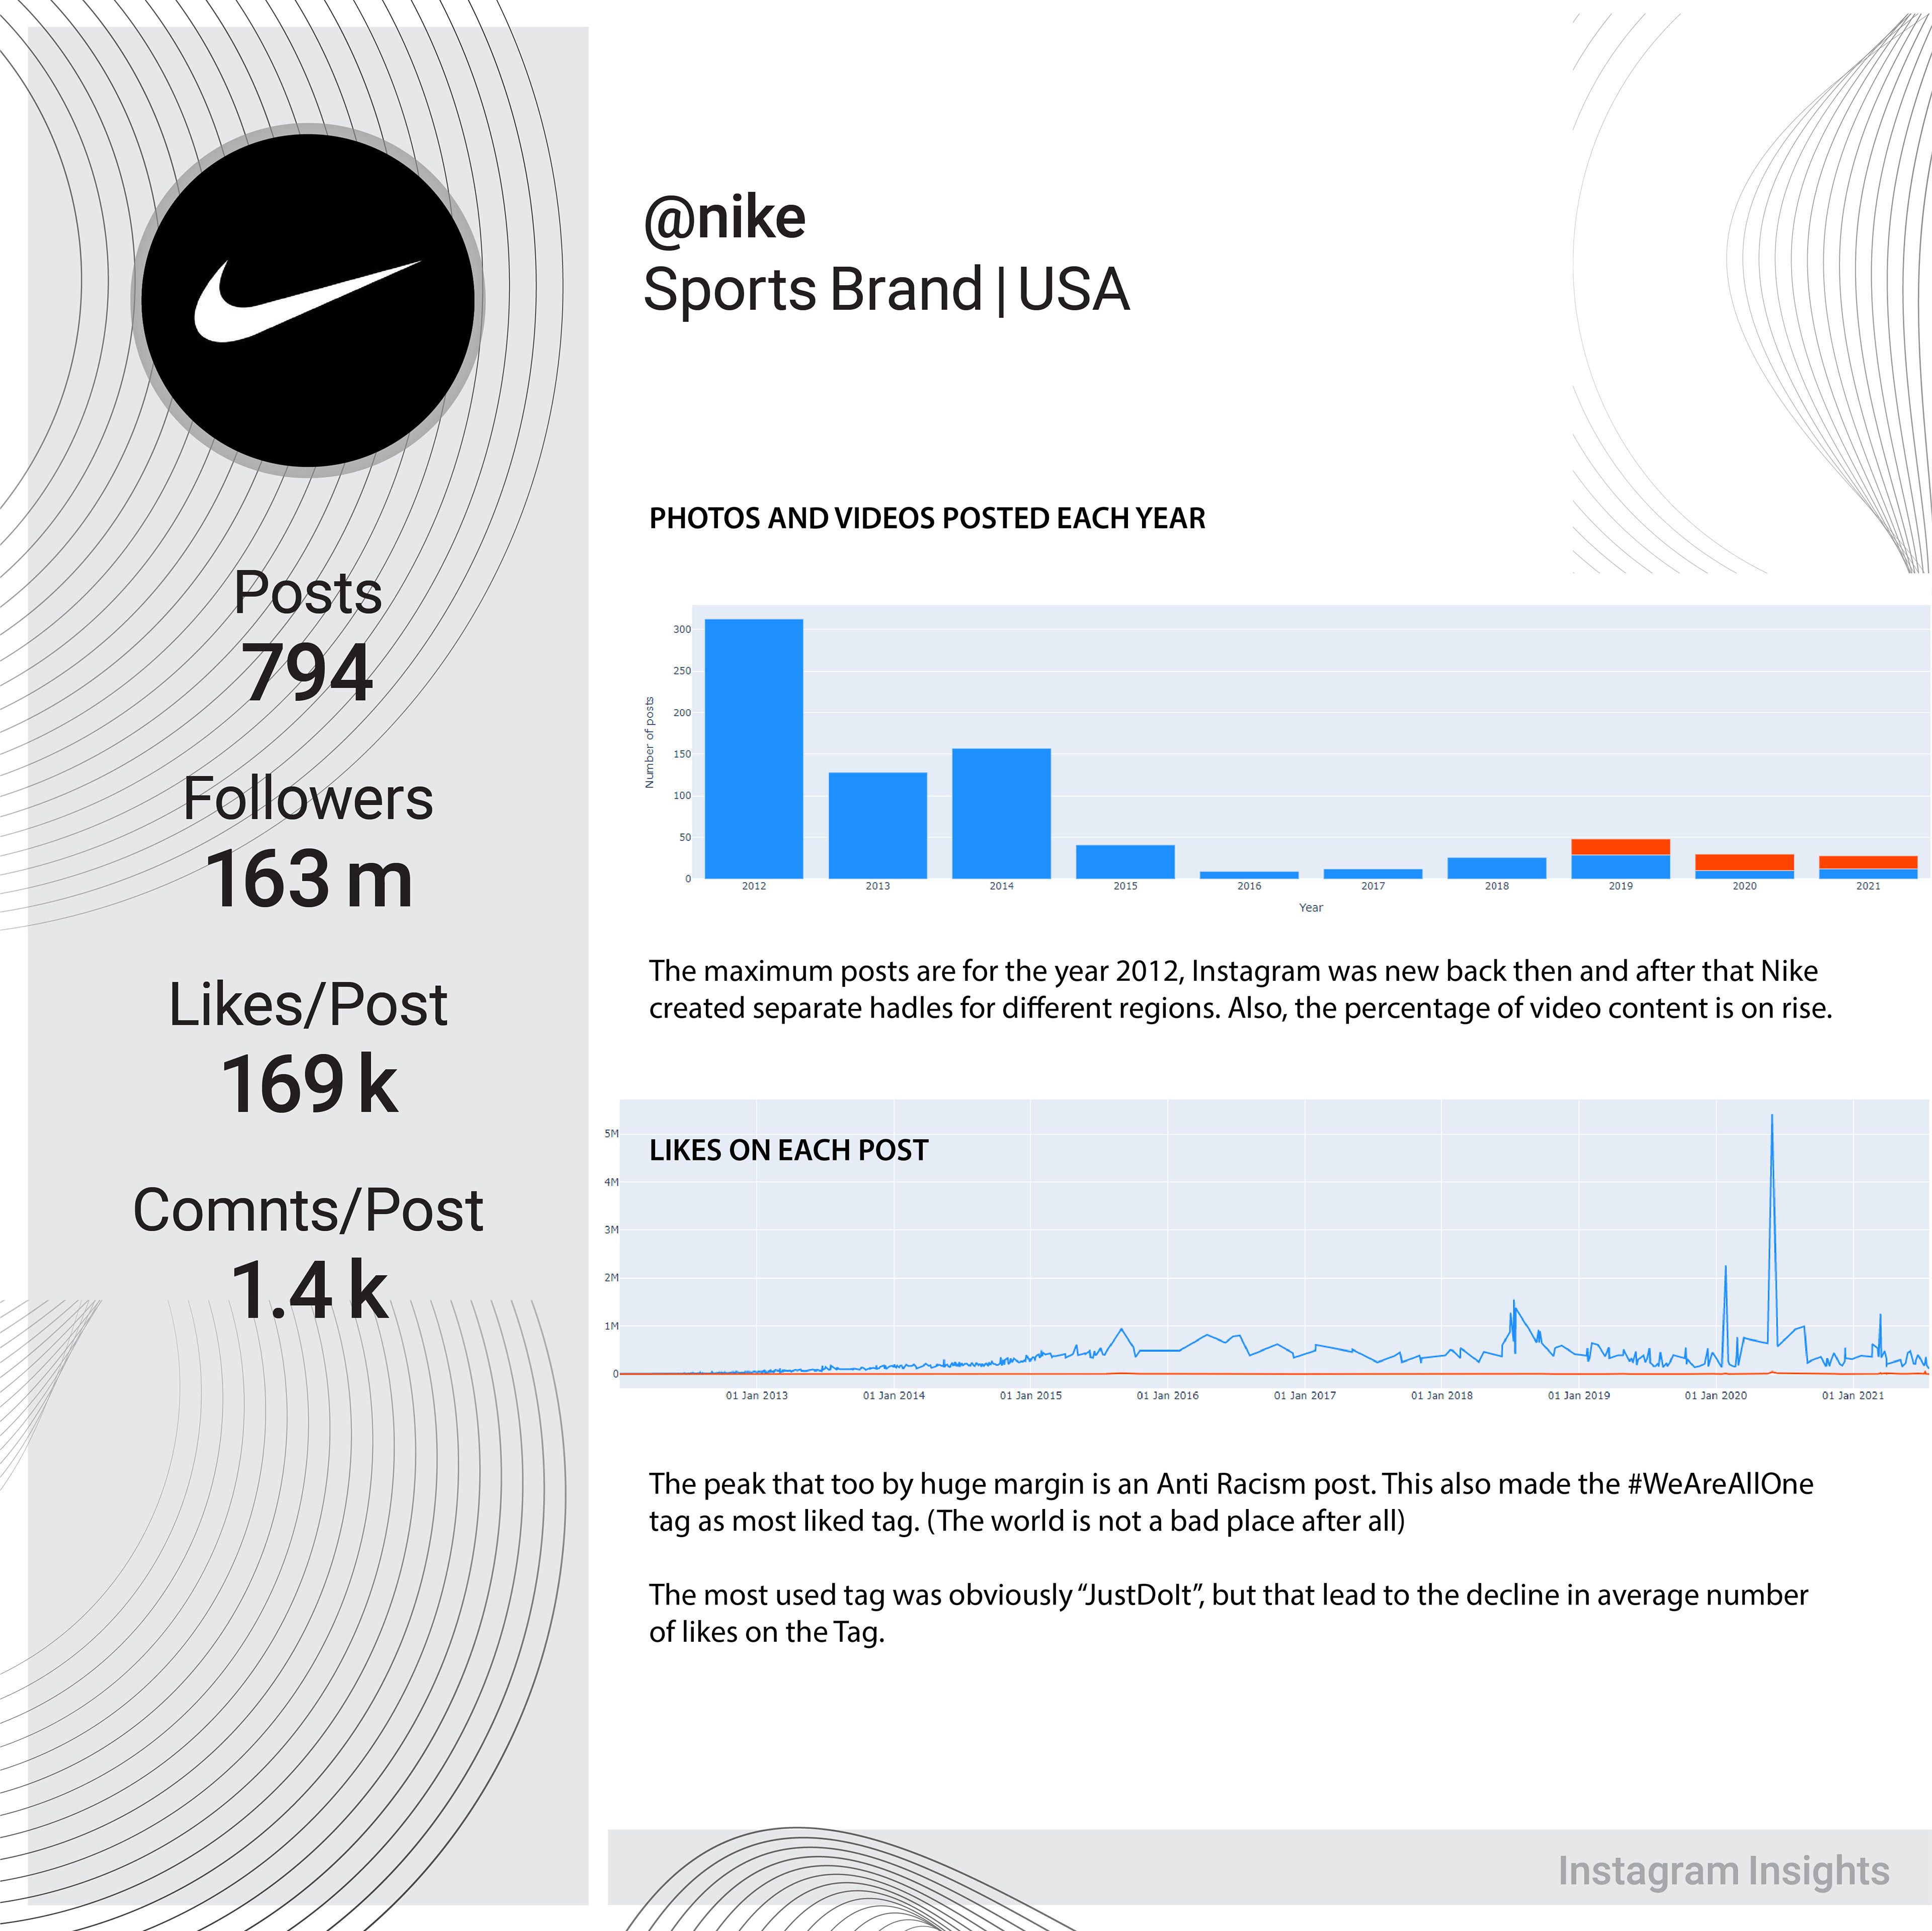
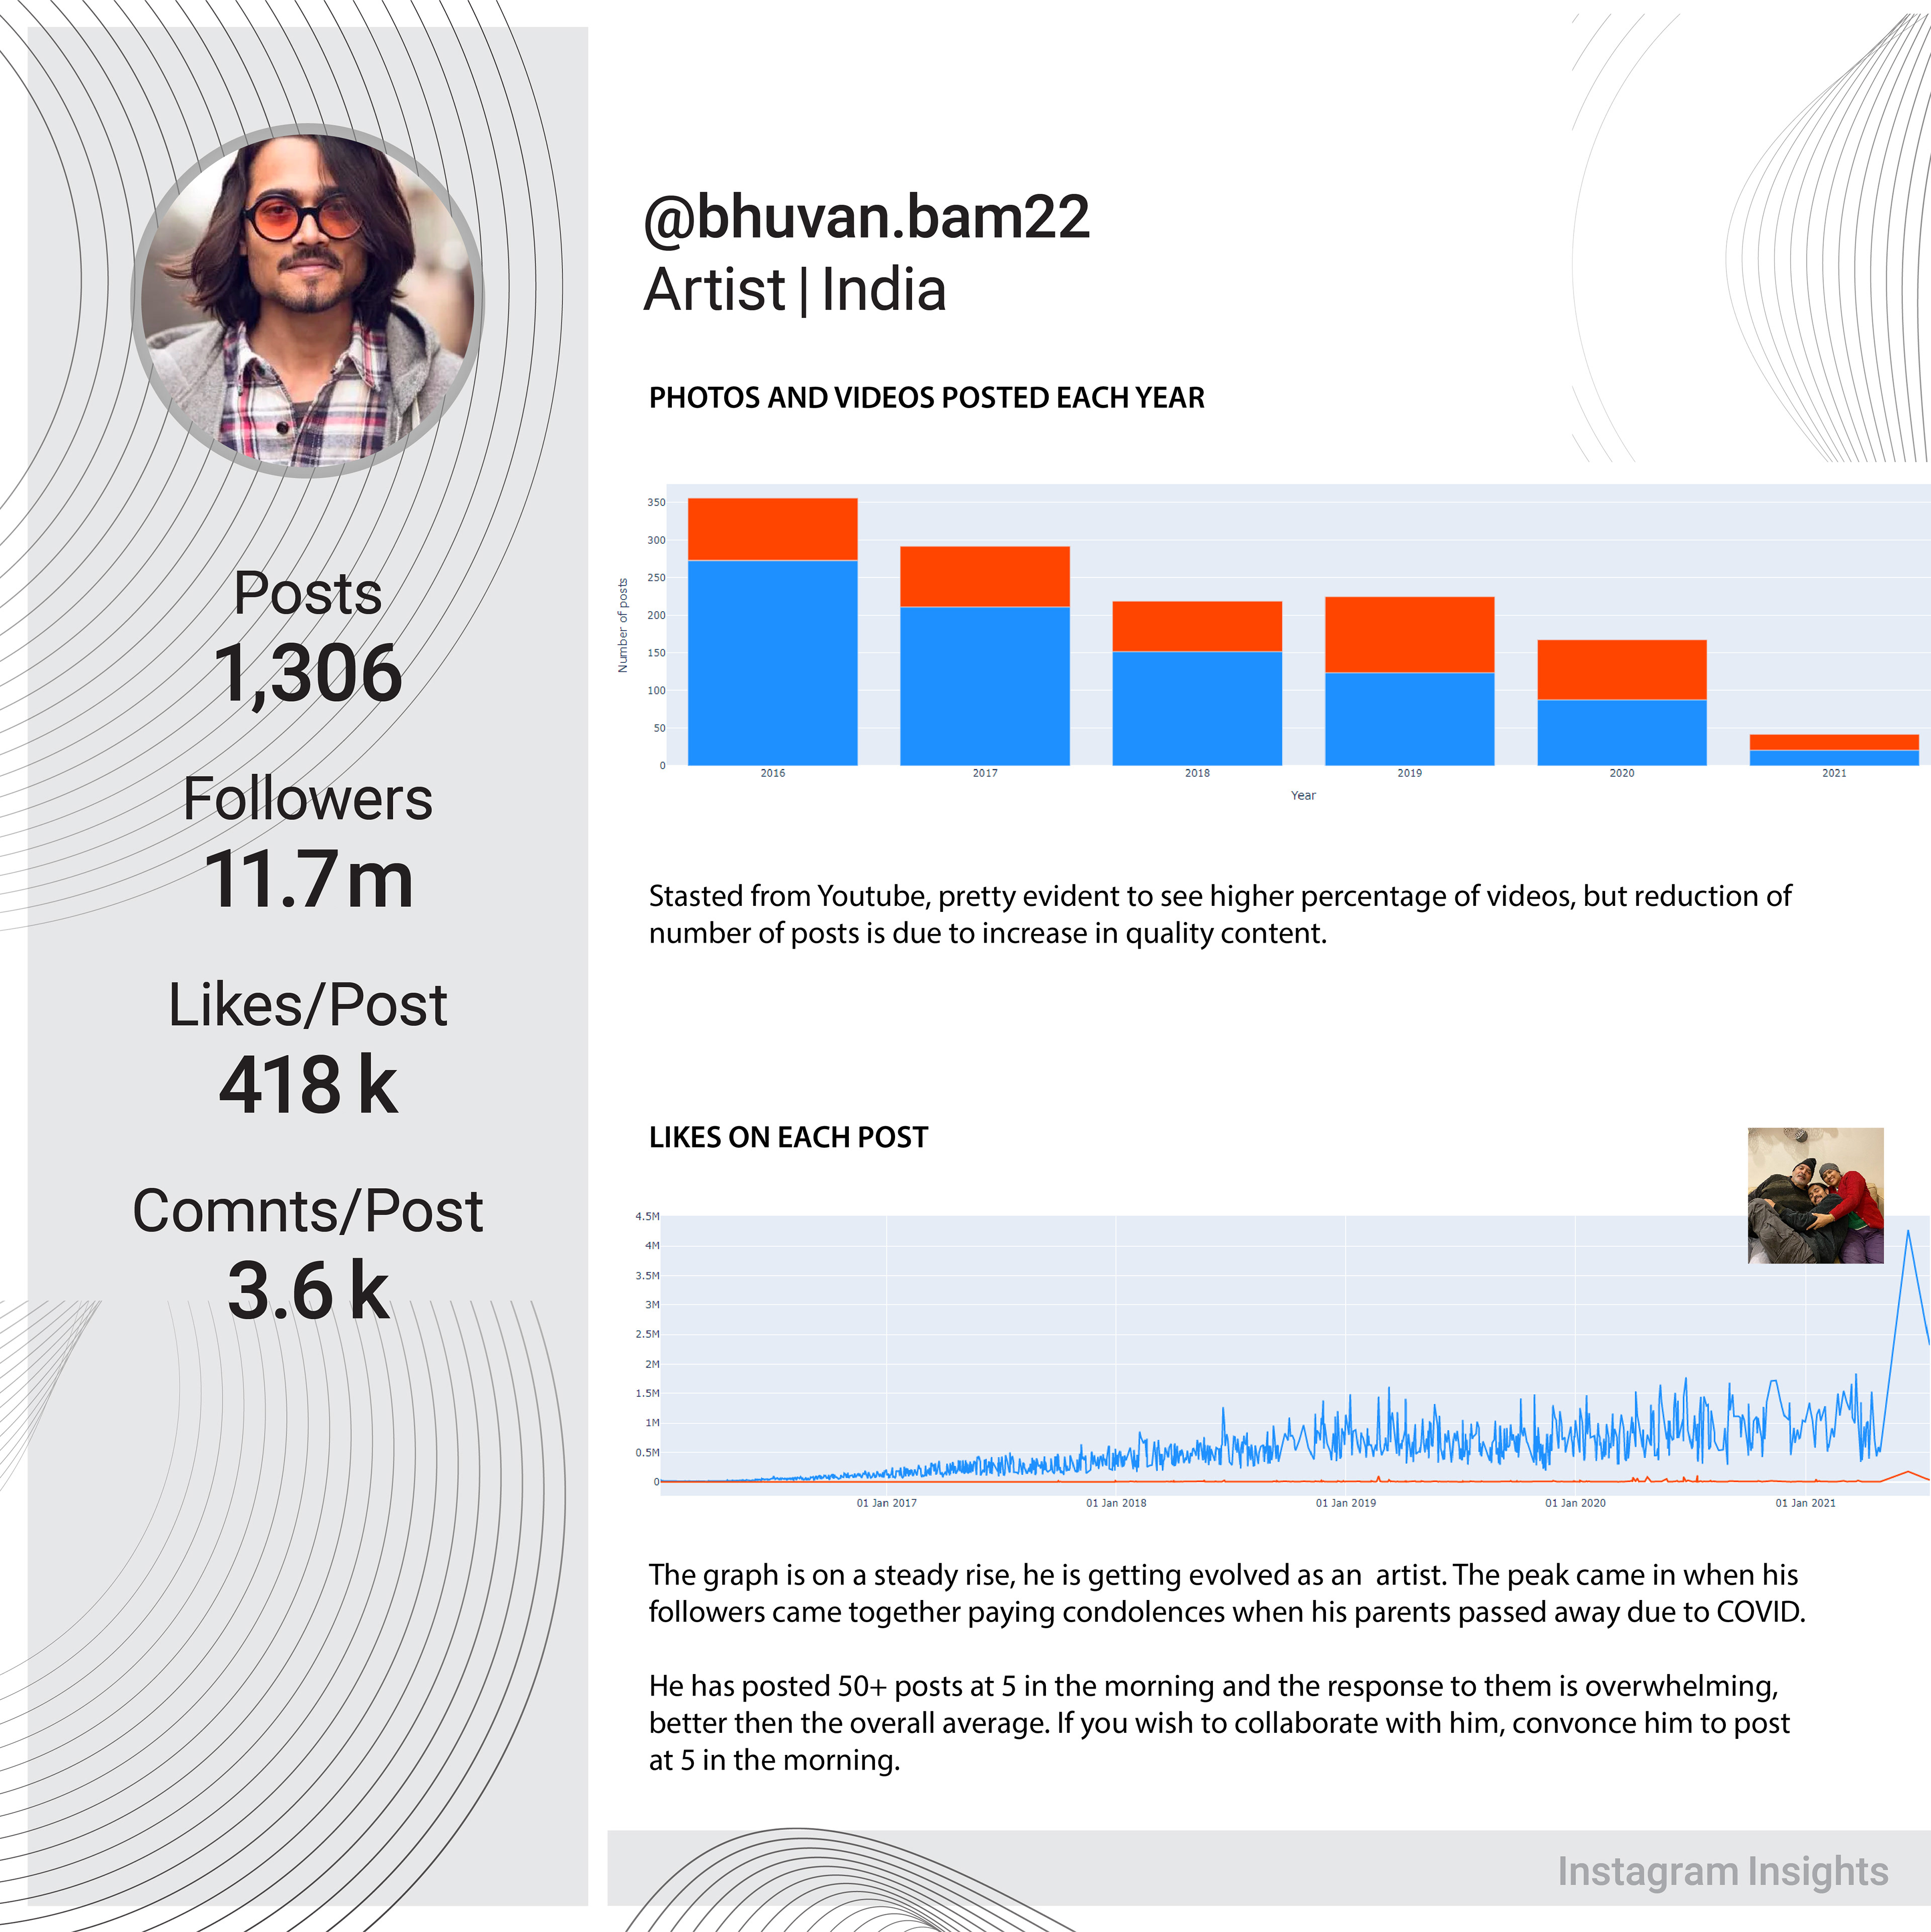
2. Number of photos and videos posted each year
3. Average likes per day
4. Word cloud of the most used words in captions
5. Chart for number of frequency of Hashtags used
6. Average likes received per hashtag
7. Frequency of tagging other accounts
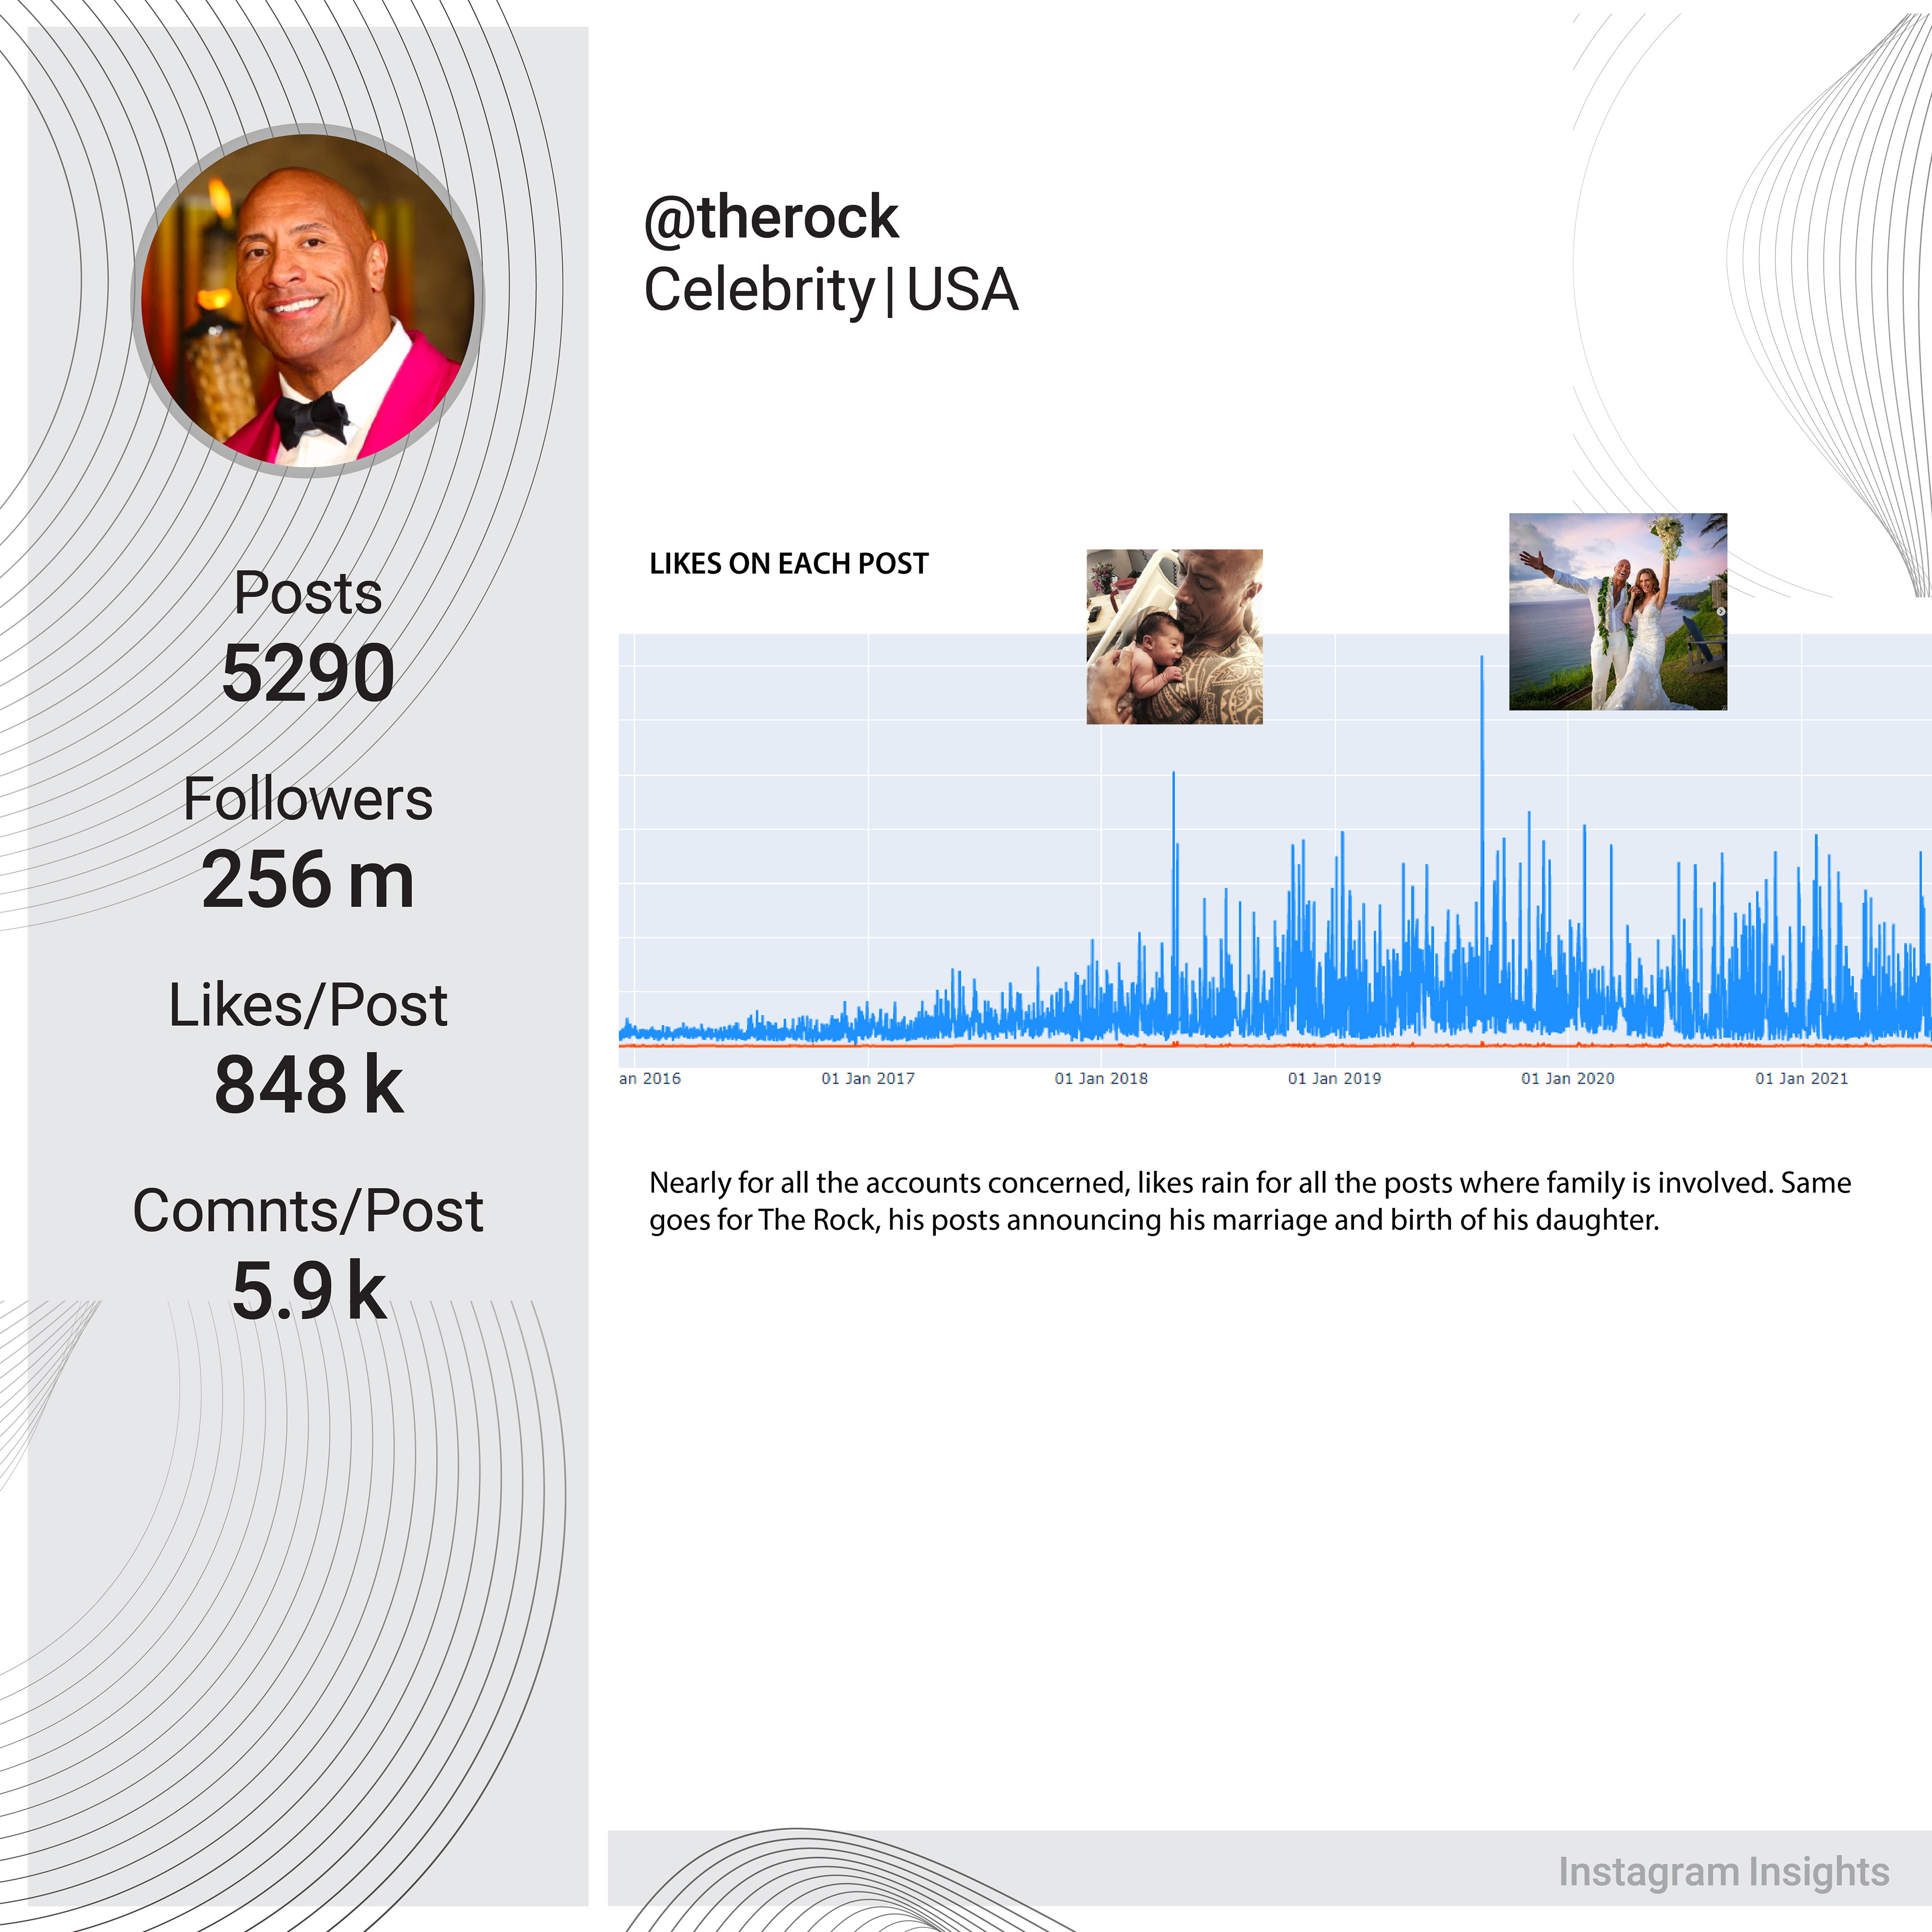
8. Likes received on each post
Analysis and Results
Politics / Barack Obama and Narendra Modi
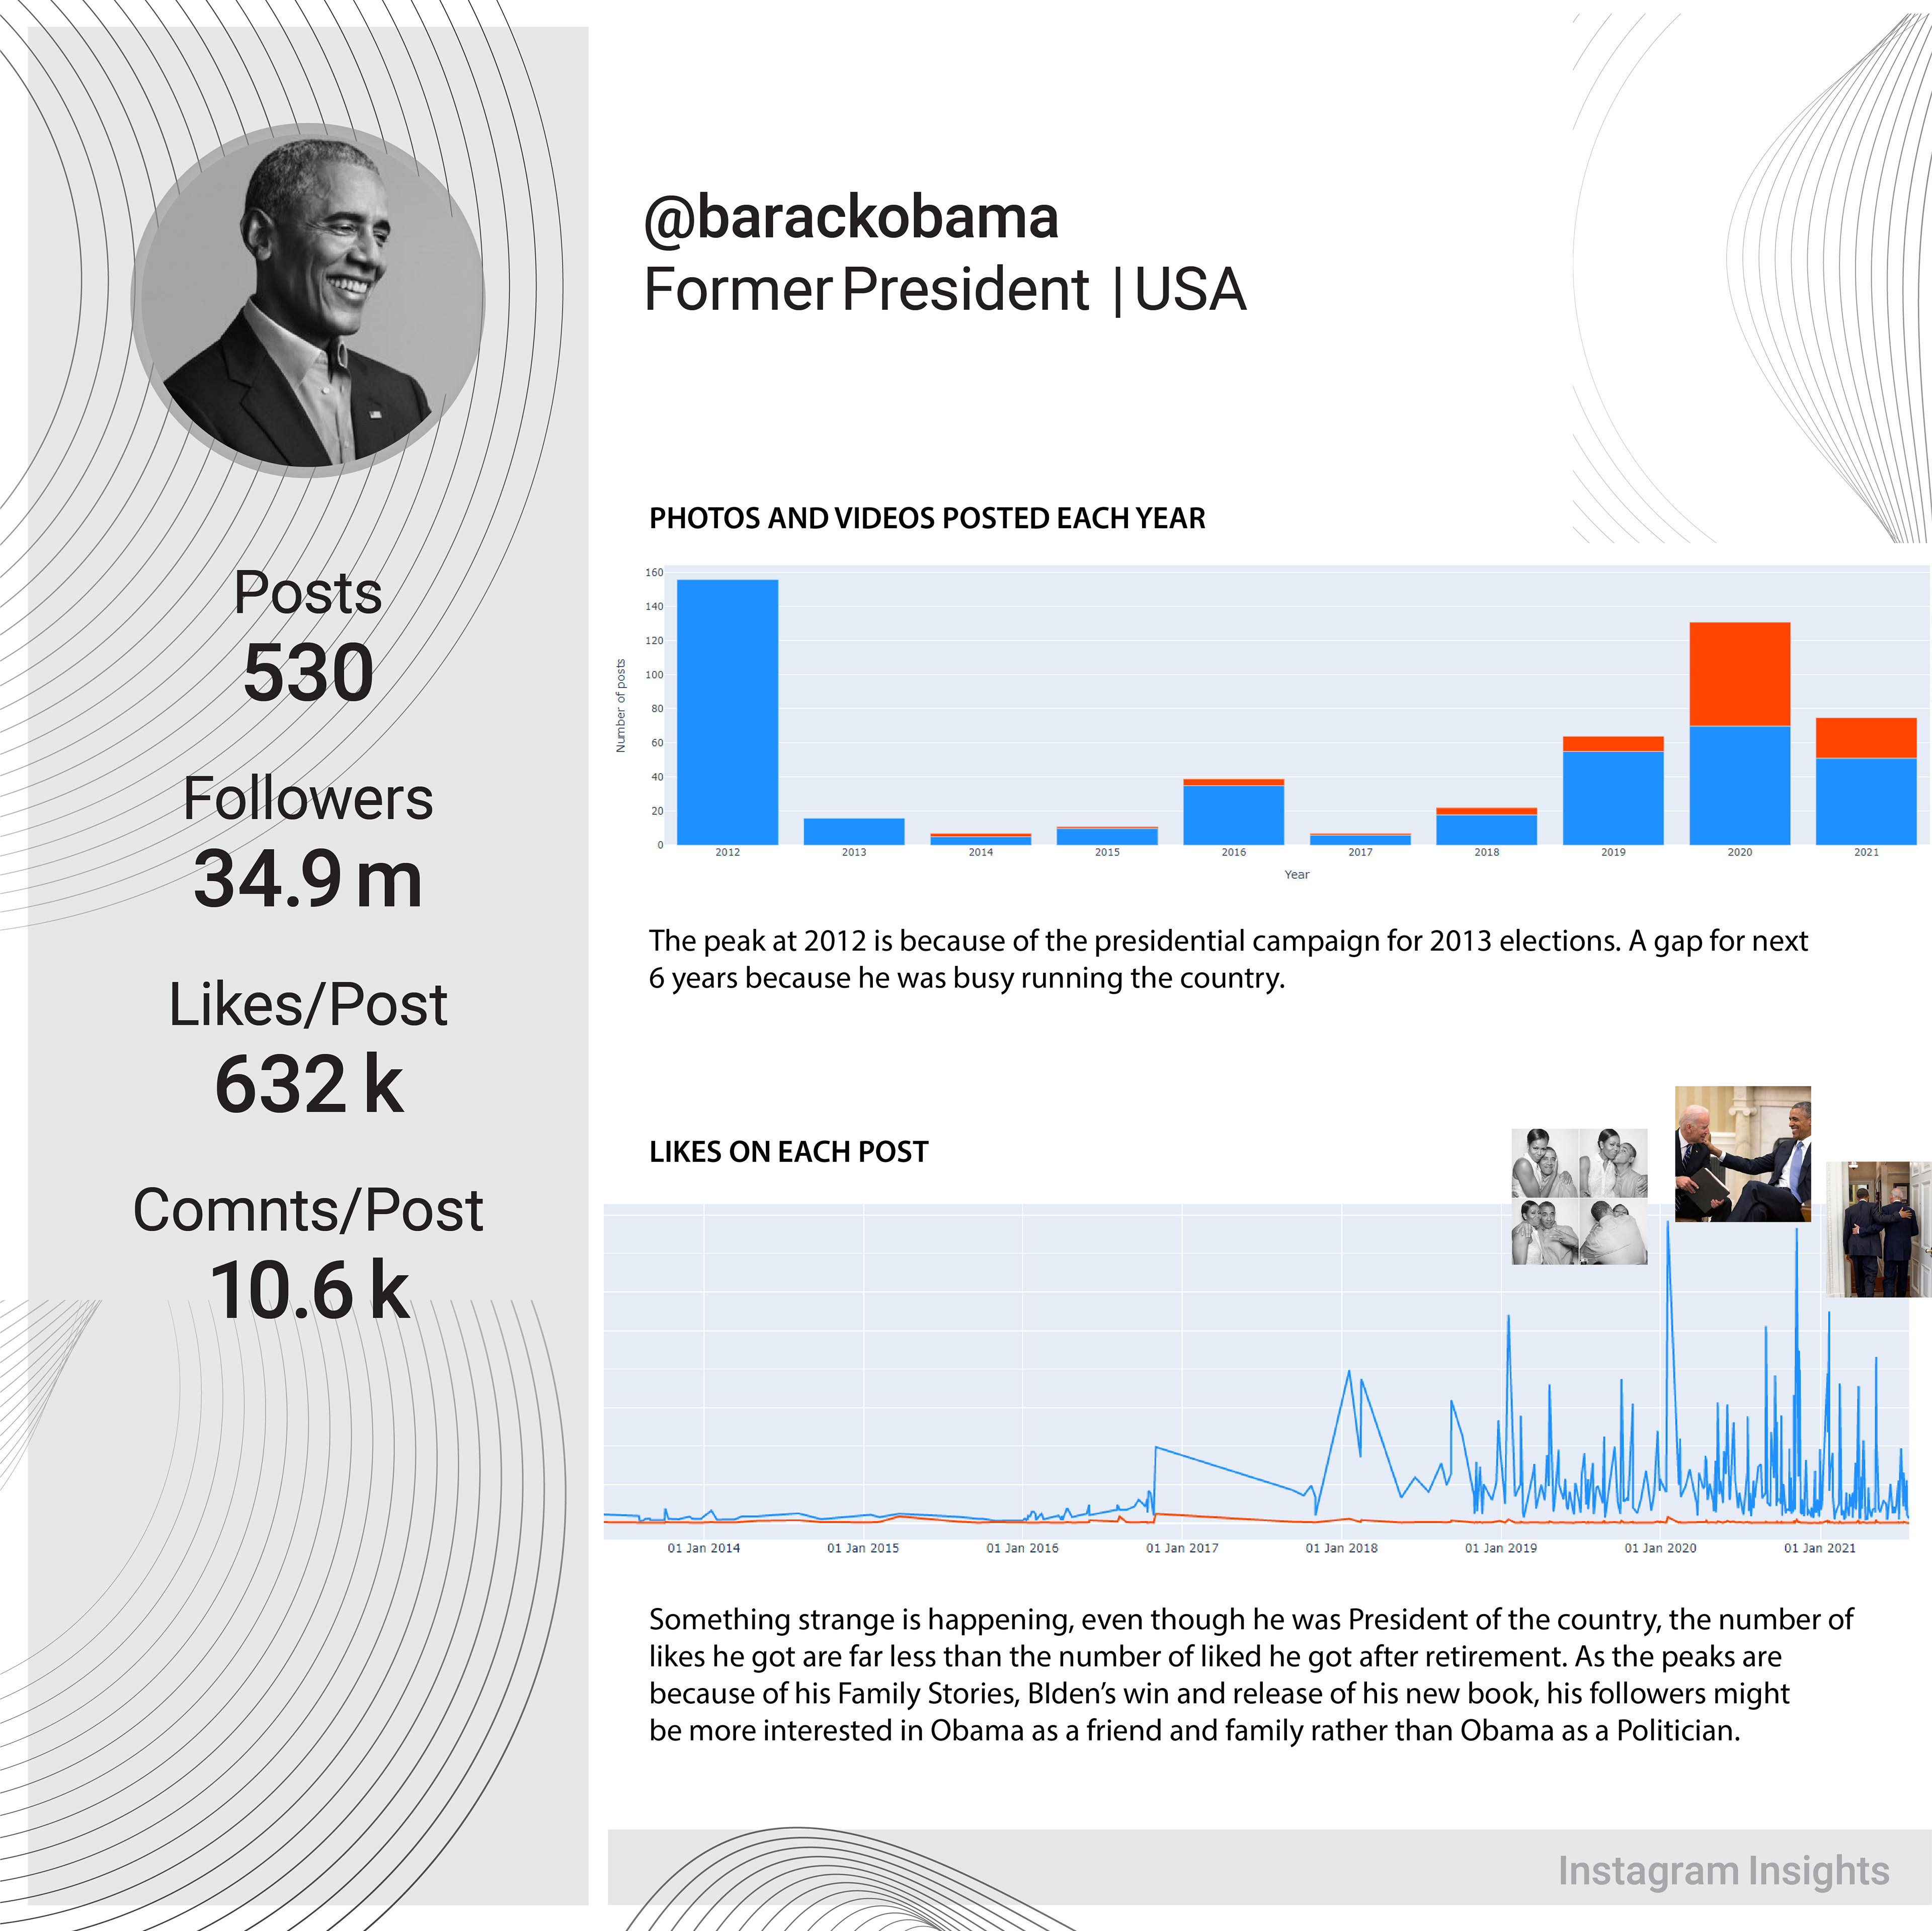
Politics / Barack Obama
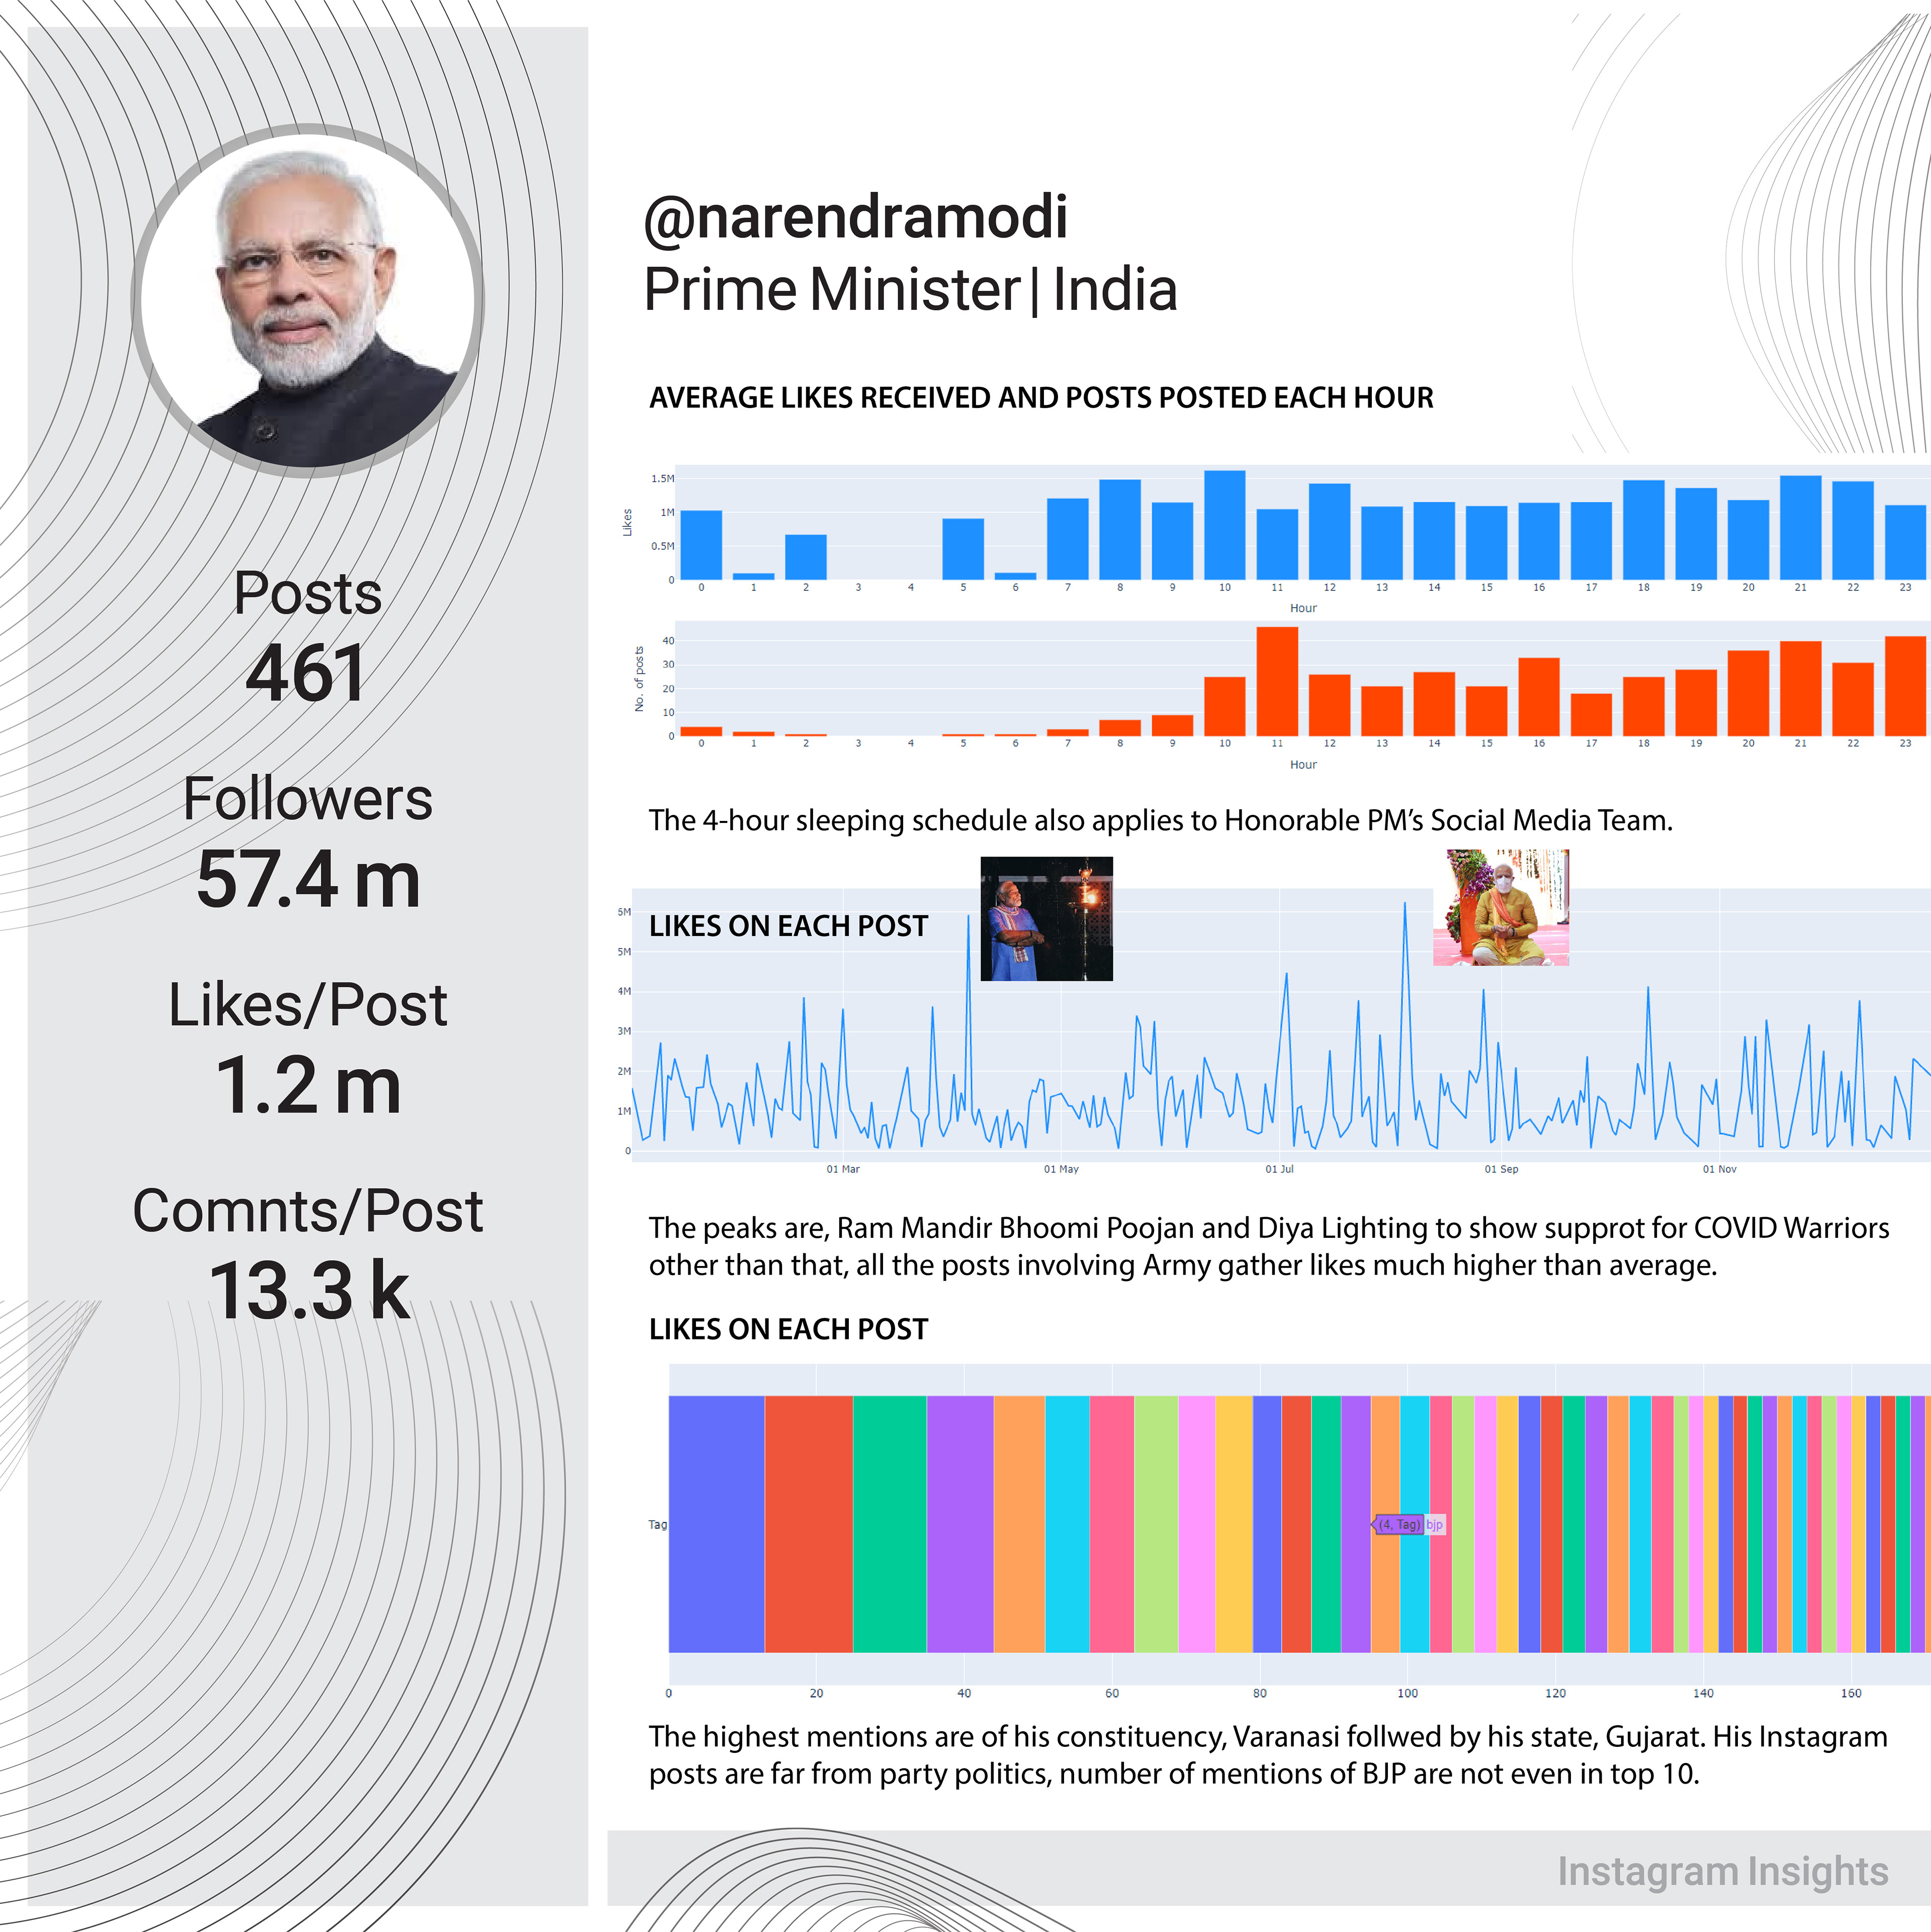
Politics / Narendra Modi
Music / BTS and Arijit Singh

Celebrity / Priyanka Chopra and Dwayne Johnson

Artist / Banksy and Akshar Pathak
Brand and Influencer / Nike and Bhuvan Bam
Sports Person / Virat Kohli and Lionel Messi

A fun project
When @TheBrokenHash reached 10,000 followers, I decided to celebrate it by making a collage of all the followers. The following steps were taken:
1. Scrapped all the profile picture links into a CSV file using PhantomBuster
2. Made a script to download all the images
3. Sorted the images as per their hue values
4. Stiched the images in an array
5. Made a square grid from the linear array